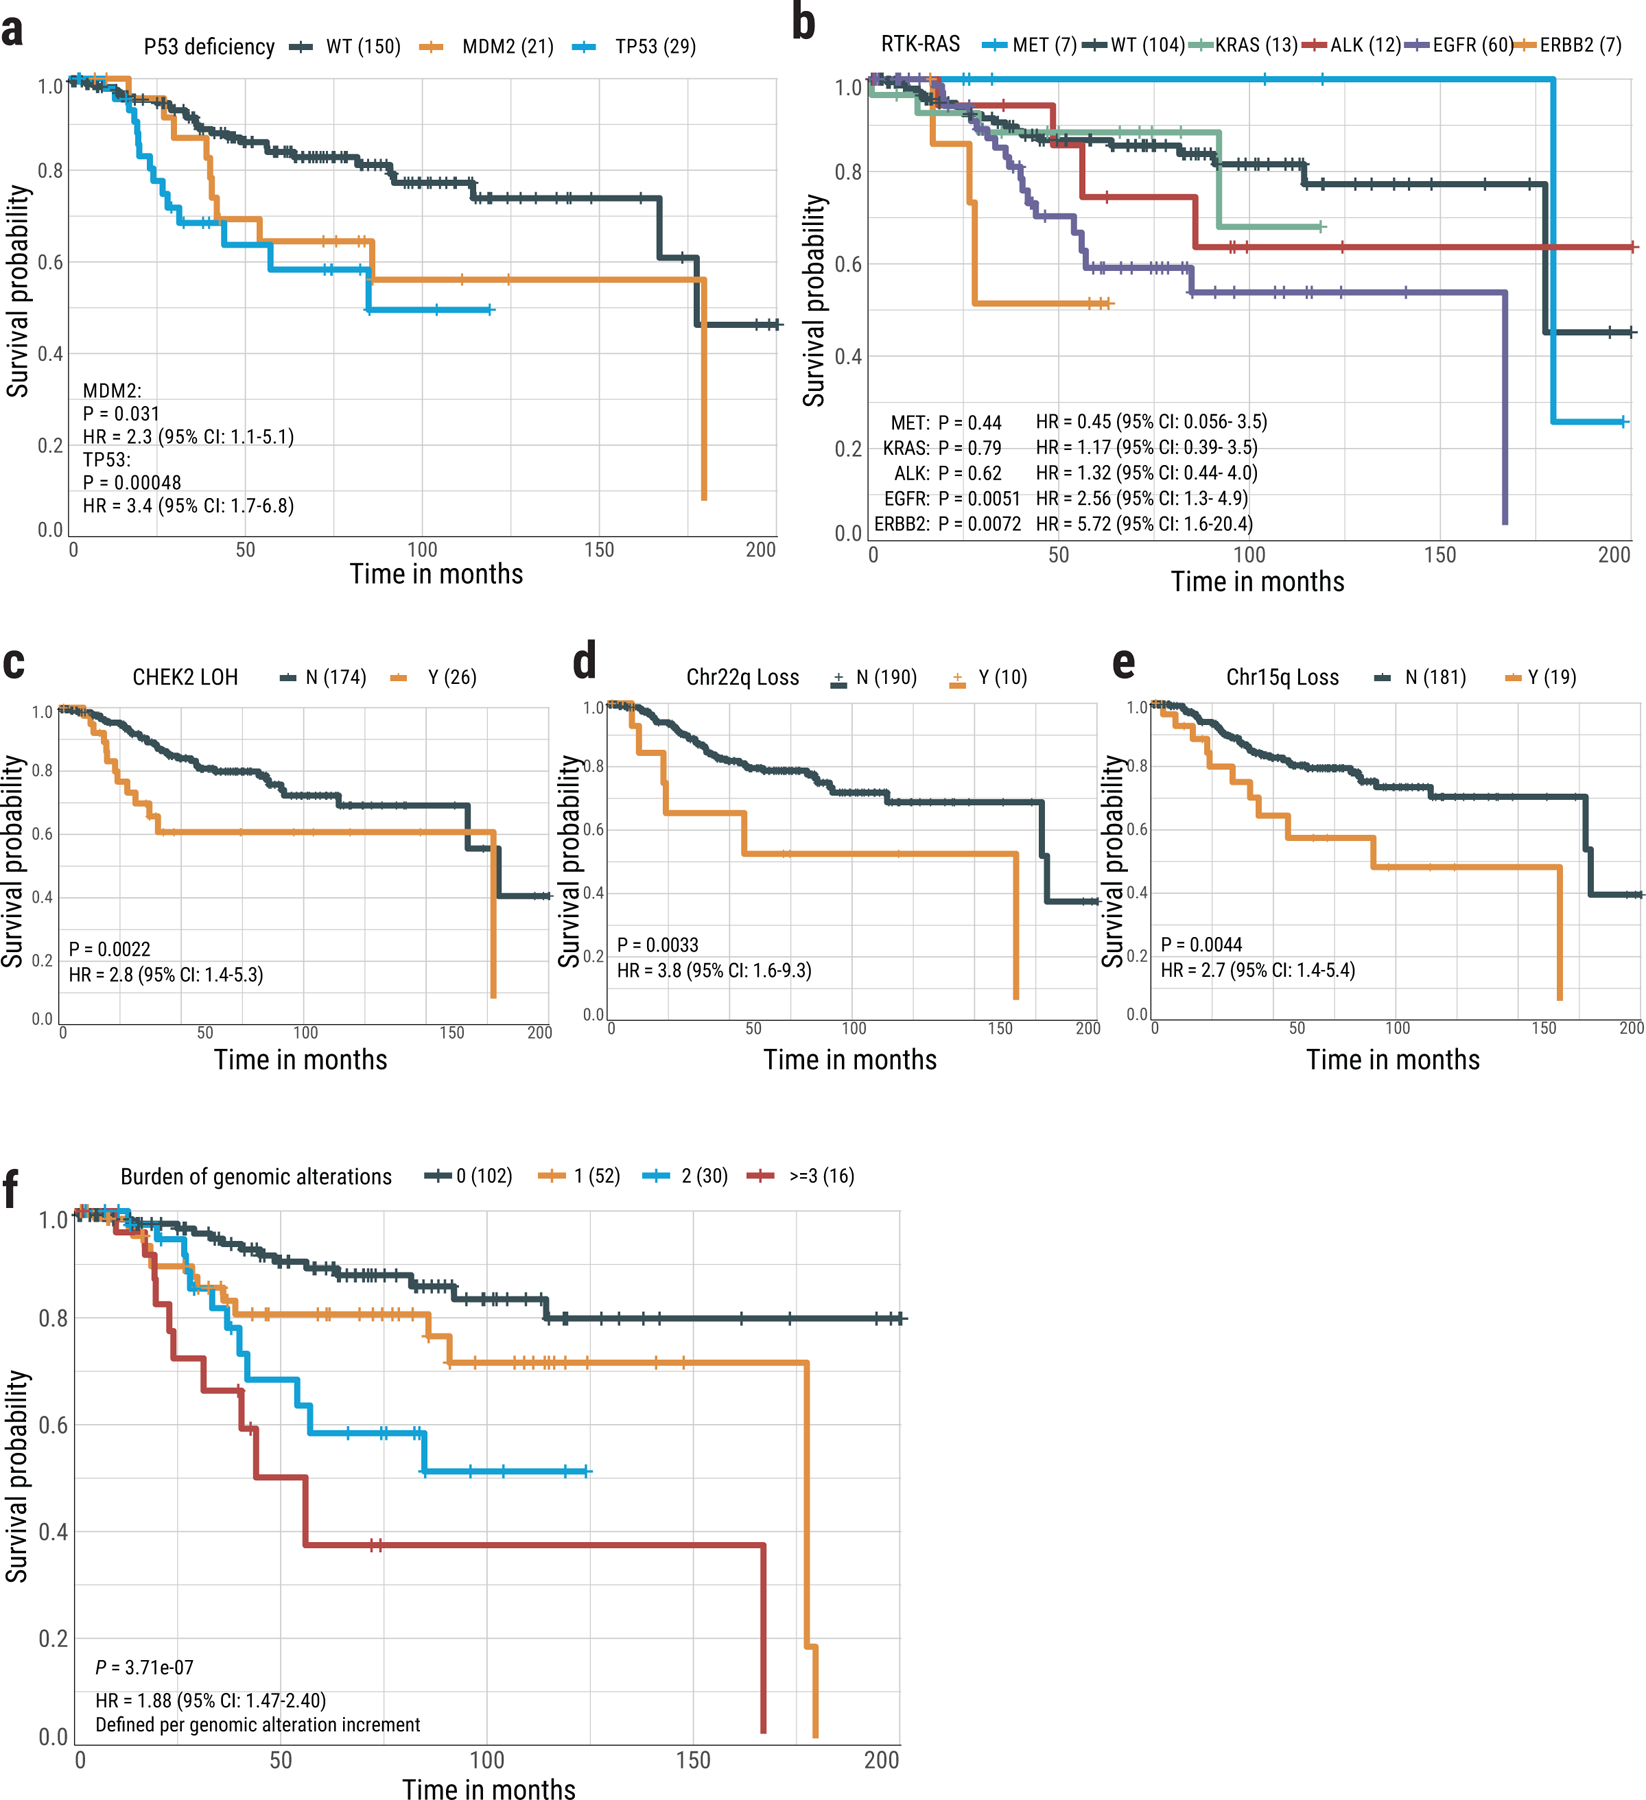
Fig. 8. Association between genomic aberrations and clinical outcomes in never smoker lung cancer patients.

Kaplan-Meier survival curves for overall survival stratified by (a) TP53 mutations and MDM2 amplification, (b) activation of individual driver genes in the RTK-RAS pathway, (c) CHEK2 LOH, (d) Chr22q loss, (e) Chr15q loss, and (f) Risk score based on the burden of five genomic alterations. P-values for significance and hazard ratios (HR) of difference are calculated using the cox proportional hazards regression (two-sided) with adjustment for age, gender and tumor stage. No multiple-testing correction applied. For groups in each plot, Y= “with” aberration; N=“without” aberration. The numbers in brackets indicate the number of patients.
