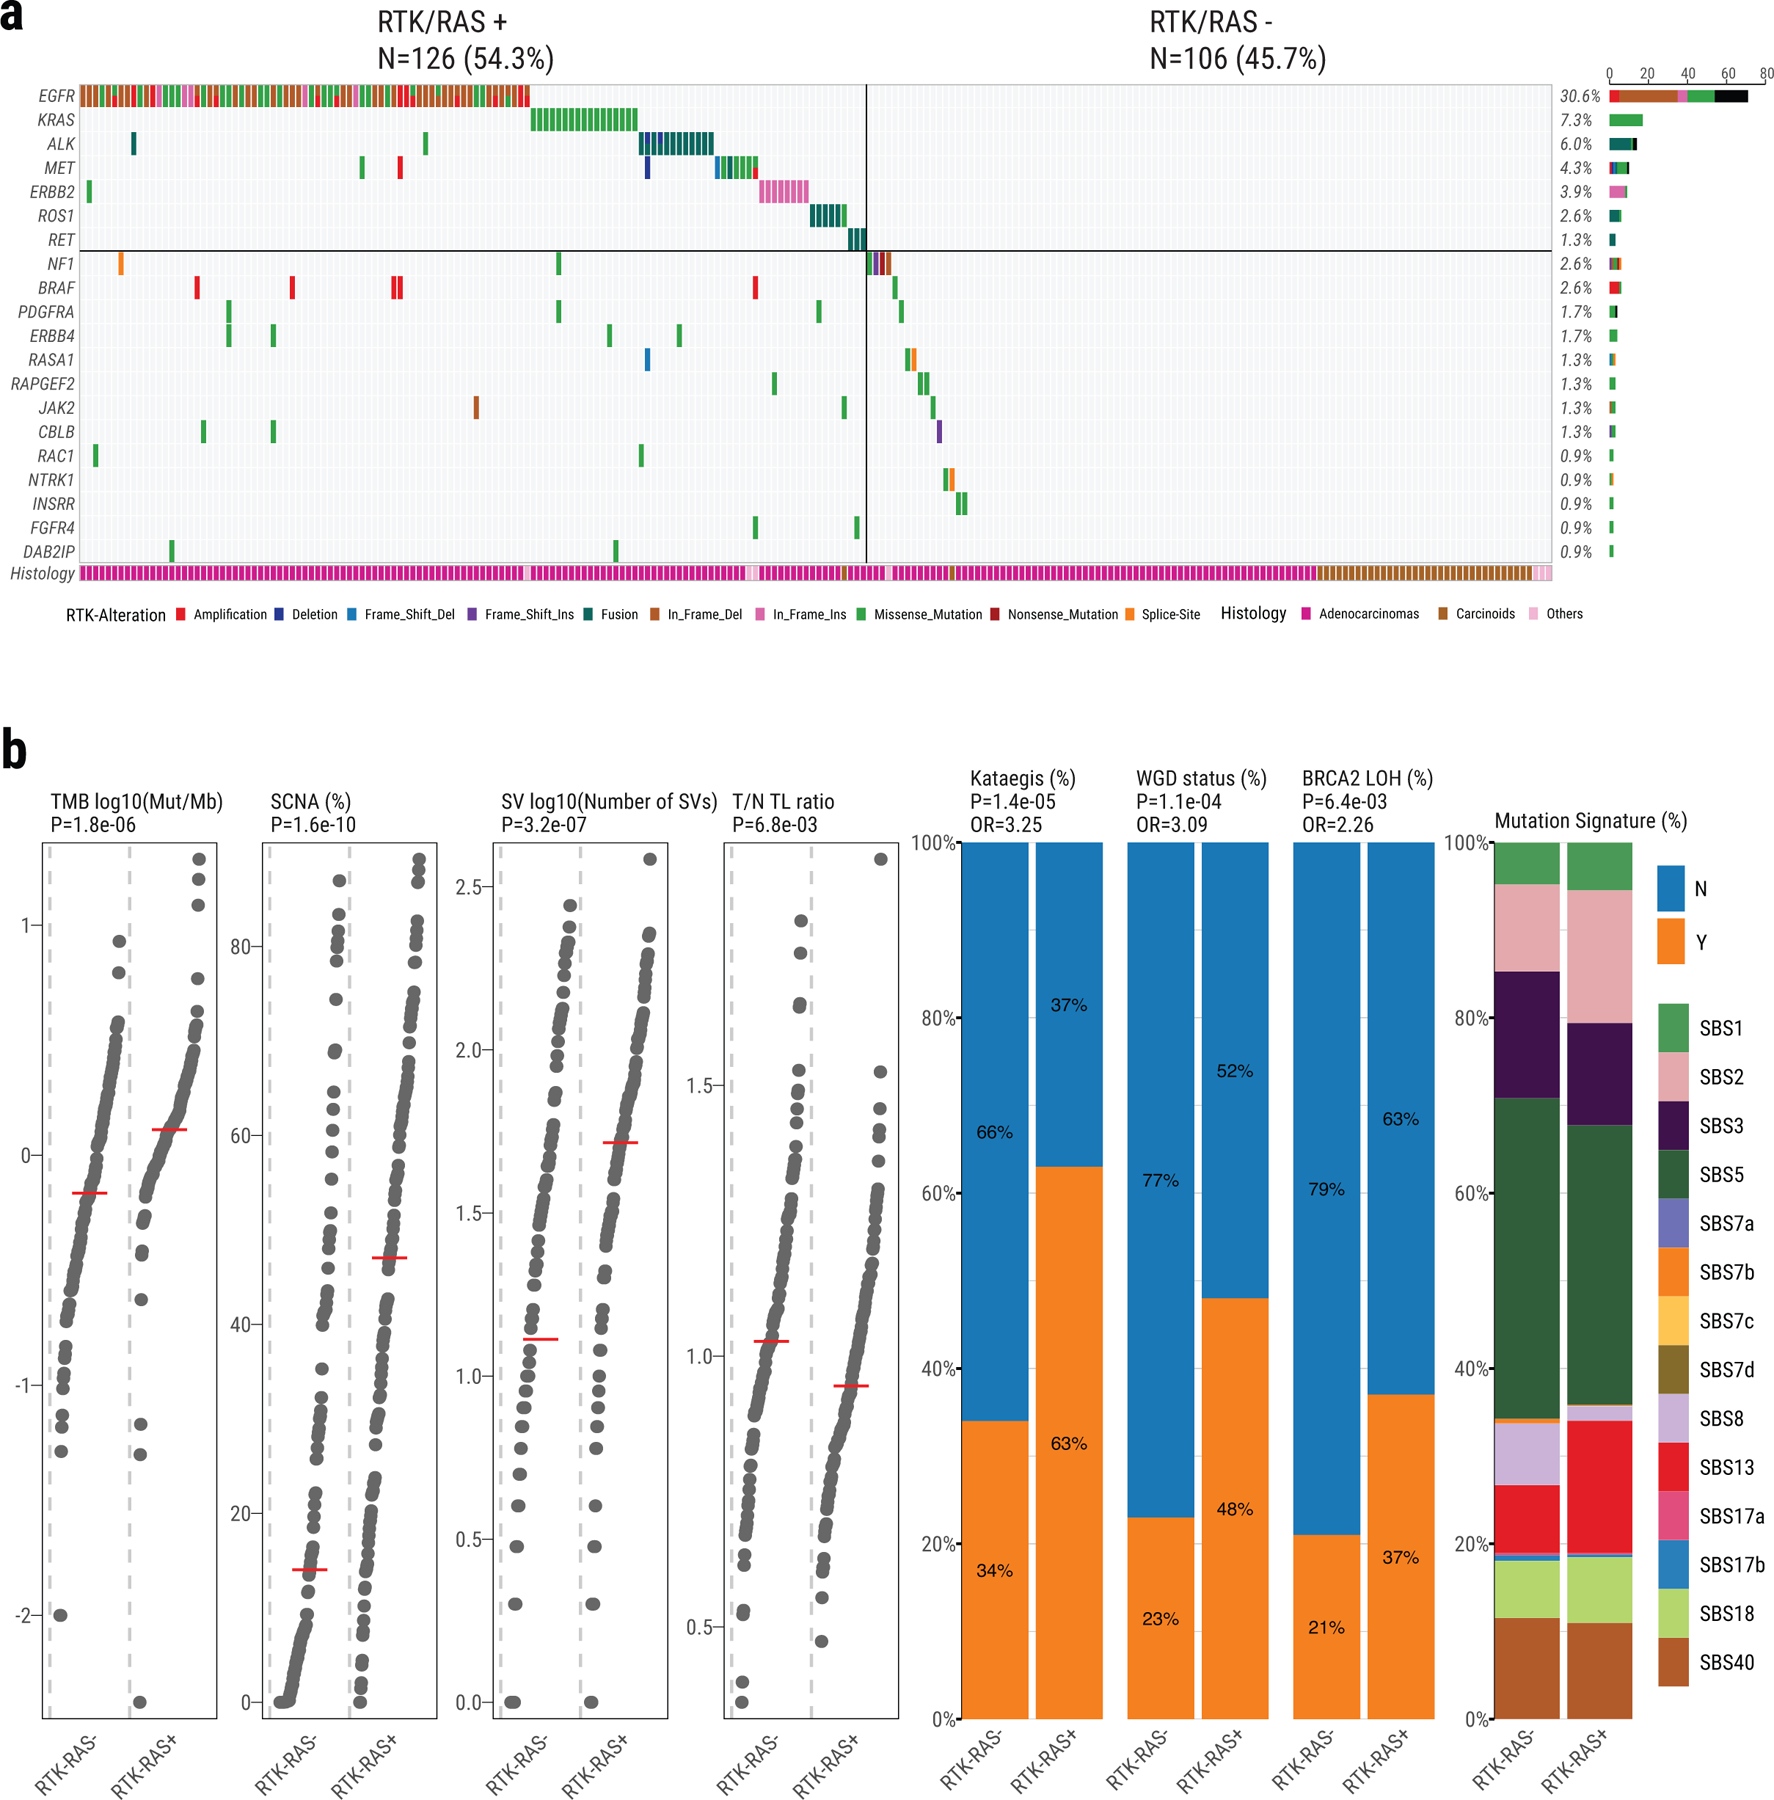
Extended Data Fig. 1. Genomic alterations of RTK-RAS pathway in Sherlock-Lung.

a, Oncoplot showing mutual exclusivity of genes within the RTK-RAS pathway, which were used to define the RTK-RAS status. The bottom bar shows tumor histological types. b, Comparison of genomic features between RTK-RAS negative and positive tumors. Left four panels: tumor mutational burden, percentage of genome with SCNAs, SV burden and T/N TL ratio. P-values are calculated using the two-sided Mann-Whitney U test; Middle three panels: enrichments for Kataegis events, WGD events, and BRCA2 LOH. P-values and OR are calculated using Fisher’s exact test (two-sided); Right panel: Contributions of each SBS signature.
