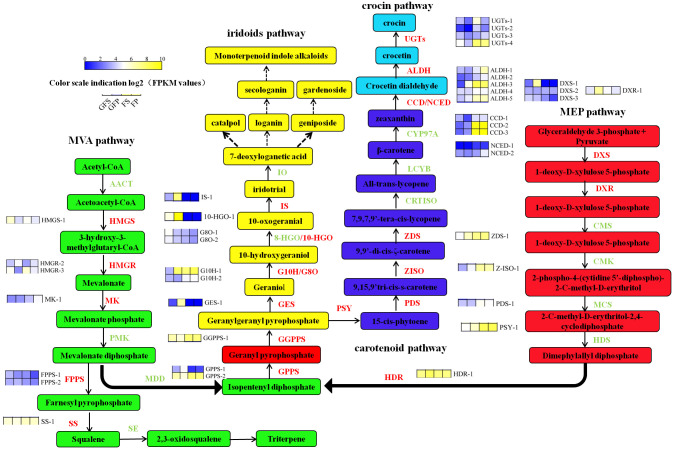
Fig 6. Transcriptional regulations during the G. jasmonoides fruit development in the biosynthesis of active components.
GFP = the peel of green fruit; GFS = the sarcocarp of green fruit; FP = the peel of red fruit; FS = the sarcocarp of red fruit. Gene expression is displayed as heat map depicting the FPKM values. Rectangles marked with yellow and blue background represent increased and reduced expression of genes, respectively. Color scale indication log2 (FPKM values). Multiple transcripts matching each gene are shown side by side near the gene names.

