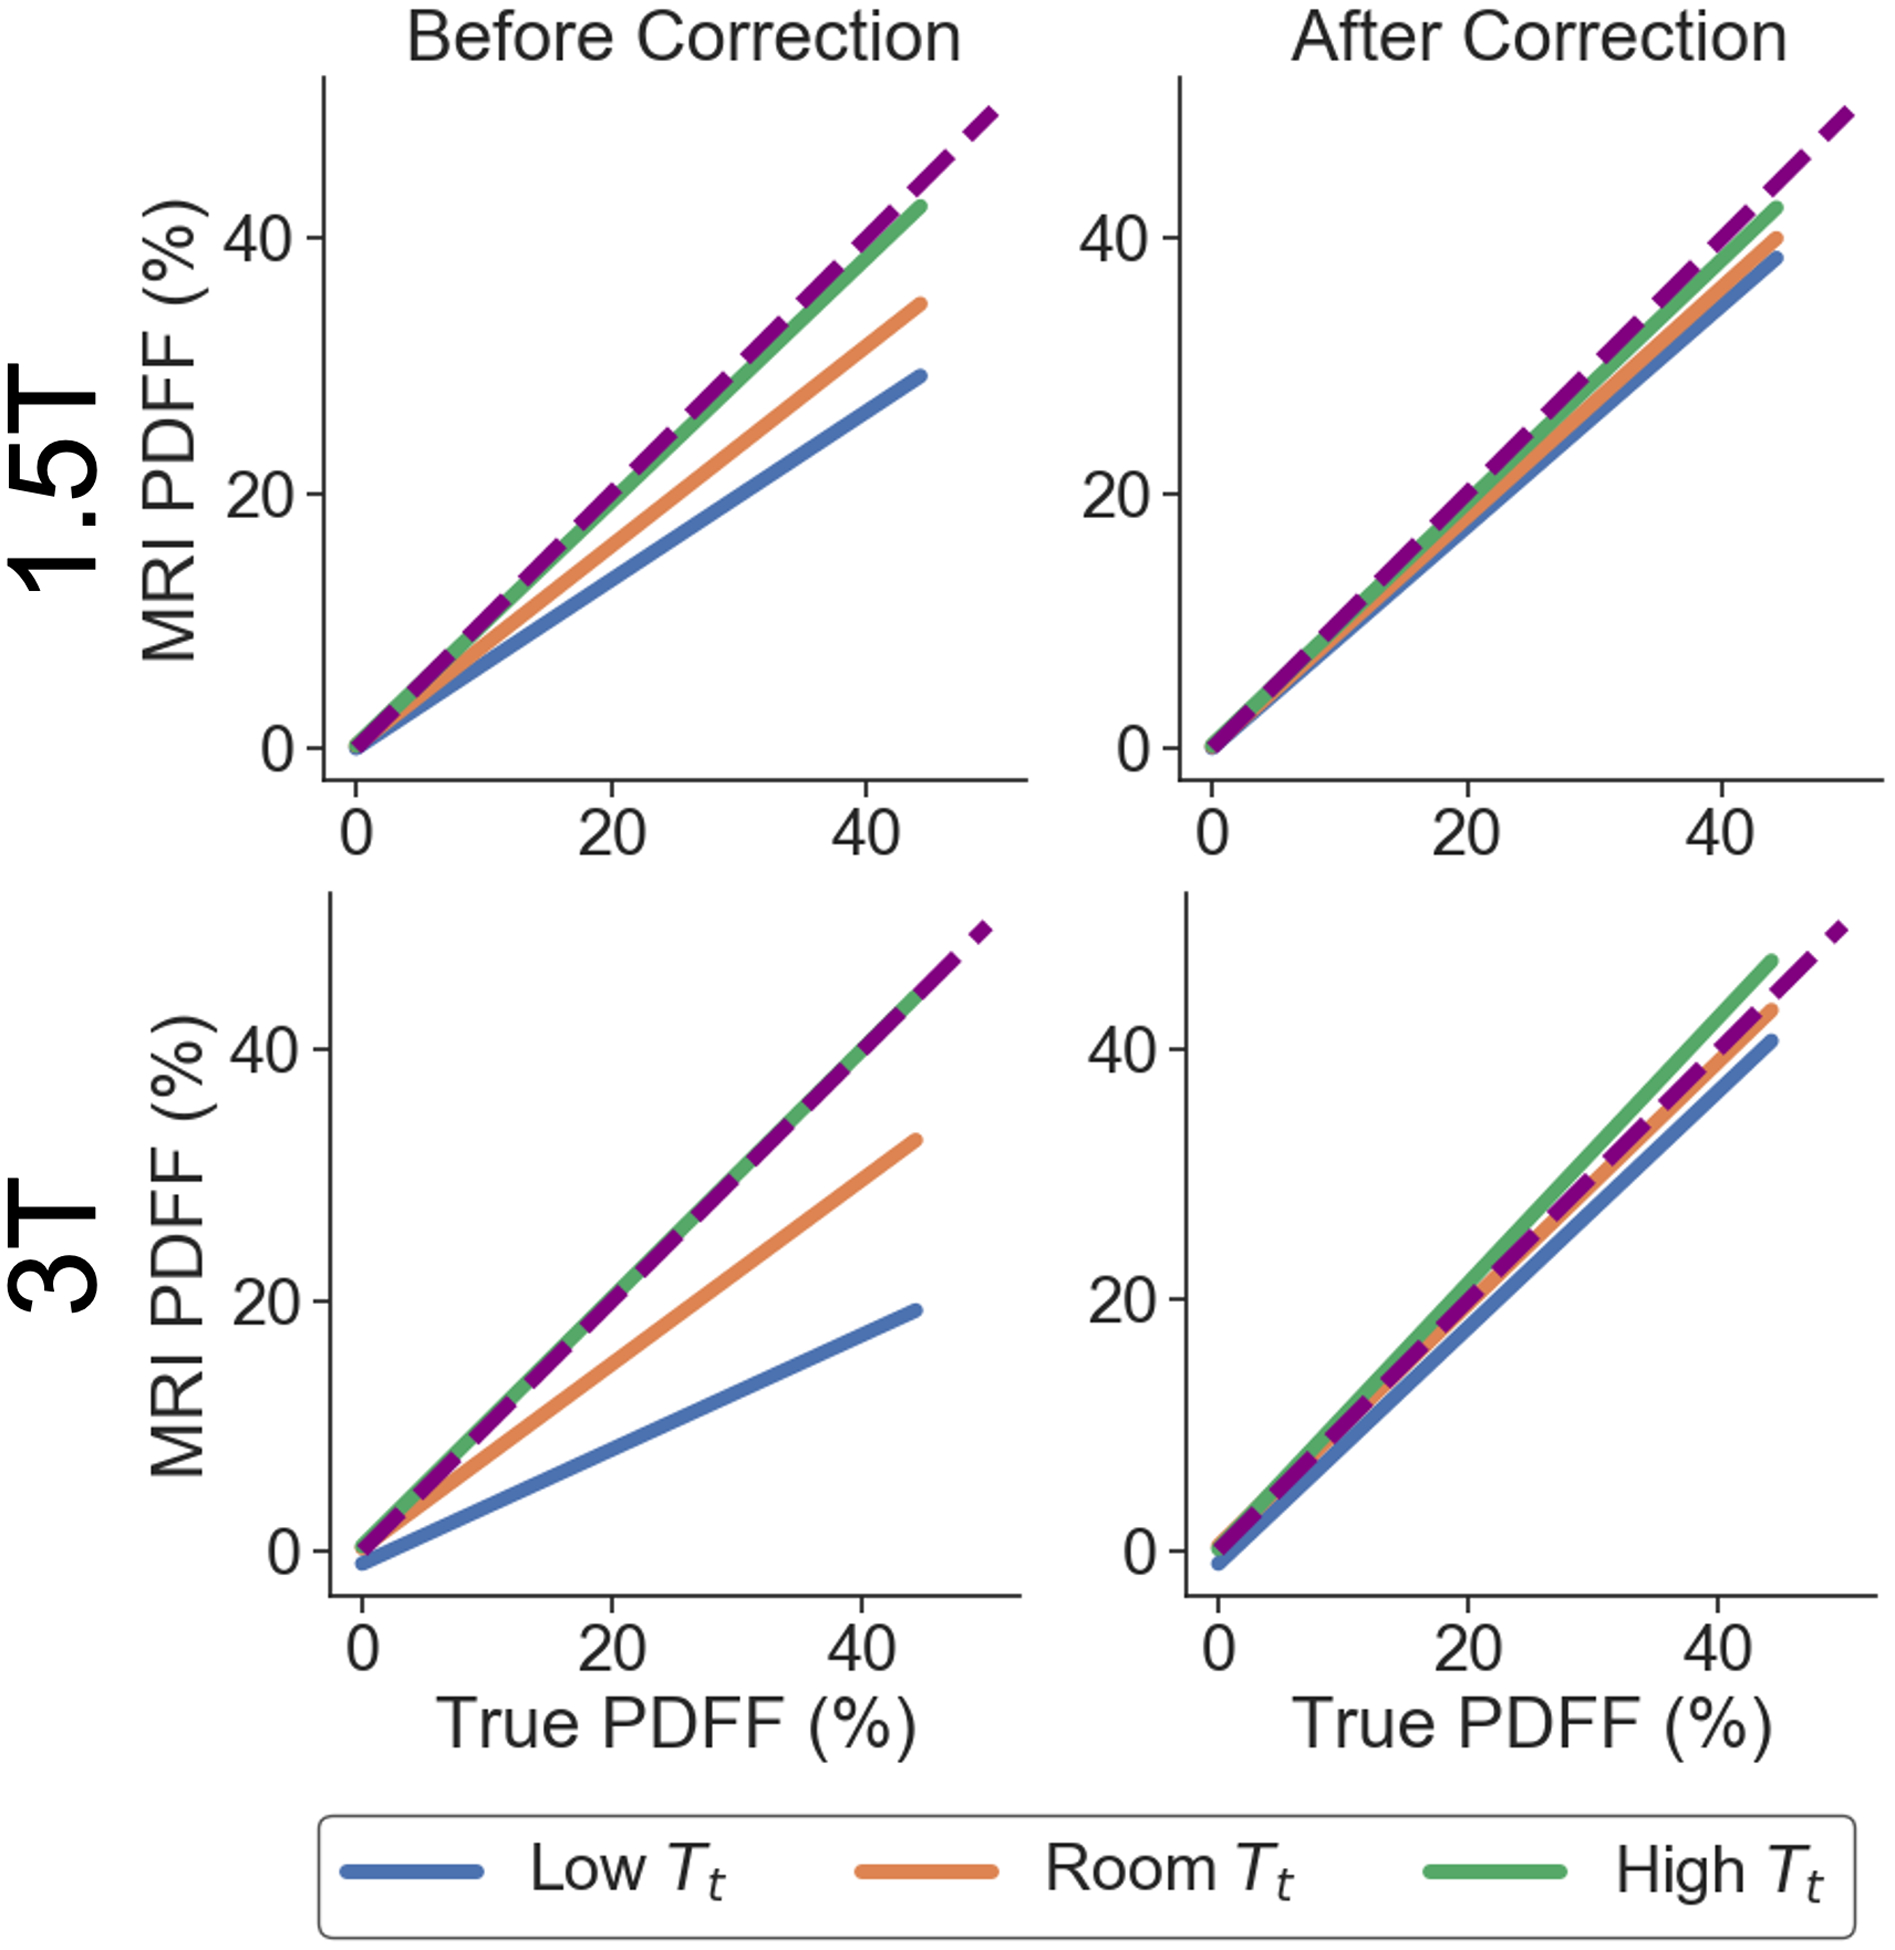
Figure 5.

PDFF bias is reduced for all given true phantom temperatures (Tt) using the proposed temperature-correction method with TG found in Figure 4. Linear regression plots of MRI PDFF as a function of the true PDFF are shown for the temperature-controlled experiments at 1.5T and 3T, before and after temperature correction, using magnitude-based methods. The identity line is also plotted as a dashed line.
