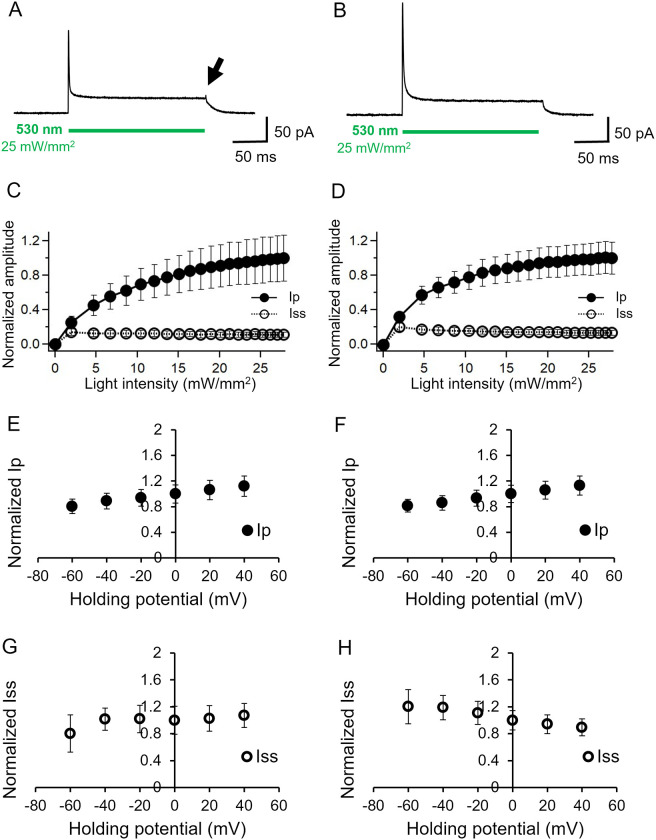
Fig 1. Basic characterization of KR2 photocurrent in ND7/23 cells.
Representative photocurrent at 0 mV in the absence (A) and presence (B) of 110 mM NaCl in intracellular solution while the bath solution contained 140 mM NaCl. pHs were adjusted at 7.4 for both solutions. See Table for more details. 530 nm light (25 mW/mm2) was illuminated for 200 ms as the green bar indicates. C and D, light power dependency on the peaks (Ip) and steady state (Iss) photocurrent, in the absence and presence of NaCl intracellular solution, respectively (n = 7). E and F, Current-voltage relation (I/V plot) for the peak current (n = 12, 9). The currents were normalized to the value at 0 mV. G and H, Current-voltage relation (I/V plot) for the steady state component. The currents were normalized to the value at 0 mV (n = 12, 9).

