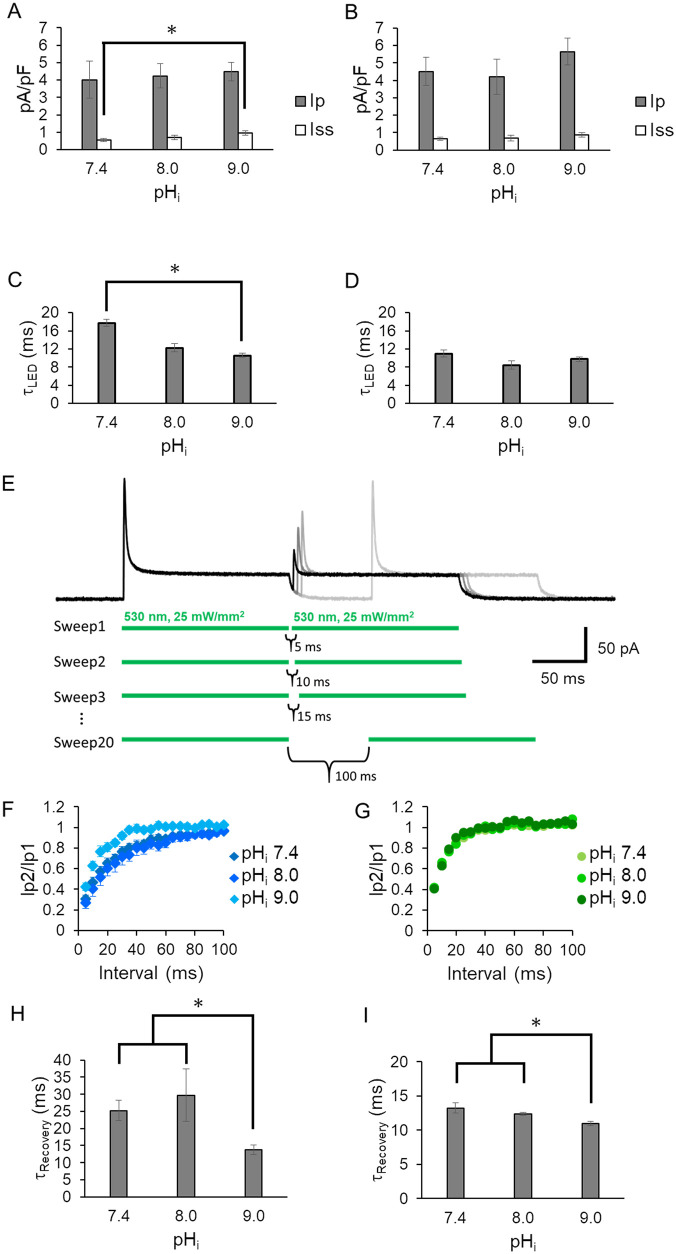
Fig 2. Effect of intracellular pH (pHi).
Photocurrent amplitude at 0 mV under three pHi conditions (7.4, 8.0 and 9.0) in the absence (A) and presence (B) of 110 mM NaCl inside (n = 6–14, *p<0.05). The bath solution contained 140 mM NaCl at pH 7.4. See Table for more details. Gray bar: peak current (Ip); white bar: steady state current (Iss). Off kinetics value (τoff LED) under 3 pHi conditions in the absence (C) and presence (D) of 110 mM NaCl in intracellular solutions. E, Representative KR2 photocurrent in double pulse experiment with various dark periods at 0 mV. LED light at 530 nm was applied as indicated by green lines below the photocurrent traces. The dark interval between the two light pulses was prolonged by 5 ms. Photocurrents traces are overlaid in different gray scales. The second peak amplitude was recovered as the dark interval was prolonged while the steady state current remained unchanged. The inter-sweep dark period was always set at 2.0 s to guarantee completed dark adaption. The intracellular solution contained 110 mM NaCl at pH 7.4 while the bath solution contained 140 mM NaCl at pH 7.4. D, Time course of the second peak recovery (n = 6–22) (F and G). The second peak ratio (Ip2/Ip1) was plotted as a function of the dark period (ms). F, The measurement was performed at three different pHi in the absence of NaCl in the intracellular solutions. G, the same experiment as in F but in the presence of 140 mM NaCl inside the cells (n = 6–8). H and I, kinetic values obtained from F and G (* p<0.05) (τRecovery). The recovery time course in F and G was plotted with a single exponential function.

