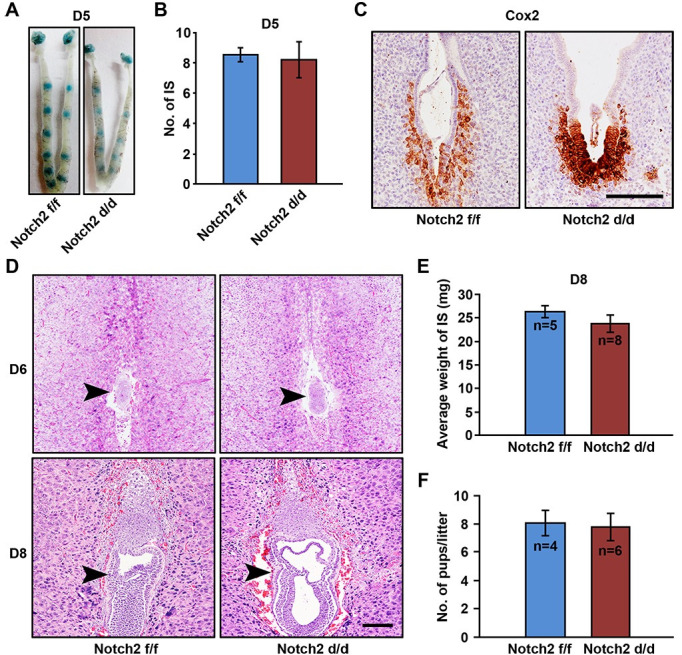
Fig 2. Uterine Notch2 deficiency did not affect implantation, decidualization and fertility.

(A) Implantation sites were visualized by intravenous injection of blue dye on day 5 in Notch2 f/f and Notch2 d/d mice. (B) The number of implantation sites on day 5 was comparable between Notch2 f/f and Notch2 d/d mice. IS, implantation sites. (C) Embryo attachment was detected on day 5 in Notch2 f/f and Notch2 d/d mice by immunohistochemistry staining for Cox2. Scale bar: 50μm. (D) H&E staining displayed normal embryo development on day 6 and 8 in Notch2 f/f and Notch2 d/d females. Arrowheads indicate the embryo. Scale bar: 50μm. (E) The average weight of implantation sites was measured on day 8 in Notch2 f/f and Notch2 d/d groups. (F) The litter size was compared between Notch2 f/f and Notch2 d/d females. Data in (B), (E) and (F) are presented as mean±SEM.
