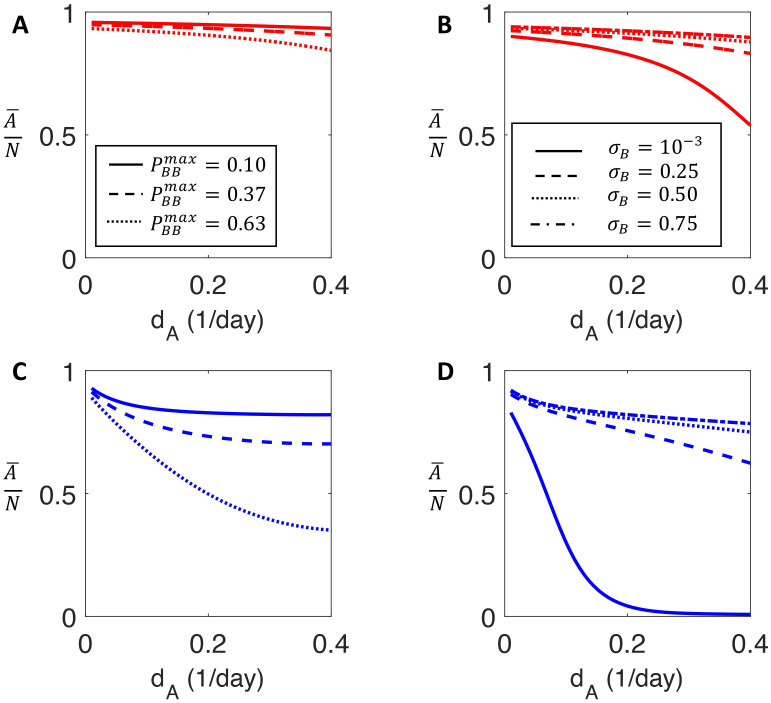
Fig 3. The proportion of drug-sensitive cells for increasing values of the sensitive cell death rate.
A and B) the proportion of the total population that is drug sensitive during Malthusian growth calculated using the stable age distribution detailed in section Stable age distribution and population proportion in S1 Text as a function of increasing sensitive death rate dA. A) plots the proportion of drug sensitive cells for three values of . B) presents the proportion of drug sensitive cells for σB = [1 × 10⁻³, 0.25, 0.5, 0.75]. If drug-tolerant cells are unlikely to retain tolerant phenotype upon reproduction, then phenotype switching can partially mitigate the effect of increasing death rate of drug sensitive cells. The proportion of drug-tolerant cells in A and B compare favourably with the population composition of drug-tolerant cells reported by Sharma et al. [15]. C and D) the proportion of drug sensitive cells in the limited-resource setting is obtained by simulating the model (2) for 500 days and computing of drug sensitive cells at day 500. C) the model predictions for . D) the model predictions for σB = [1 × 10⁻³, 0.25, 0.5, 0.75]. Phenotypic switching is less capable of mitigating increased death in the resource-limited setting.

