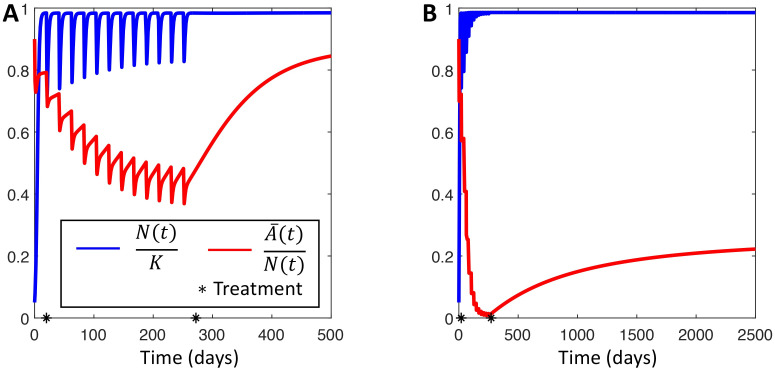
Fig 4. The effect of switching strategy on treatment efficacy.
The effect of periodic treatment on a population using either the switch (A) or the stay strategy (B). Periodic therapy is applied as described in Periodic Treatment Leads to Dominant Phenotype Switches. Therapy is applied between days 50 and 275, marked by the black stars. Red curves show the proportion of sensitive cells . Blue curves shows the dynamics of the total population as a fraction of the population carrying capacity N(t)/K. Model parameters used in these simulations are given in Table A in S1 Text.

