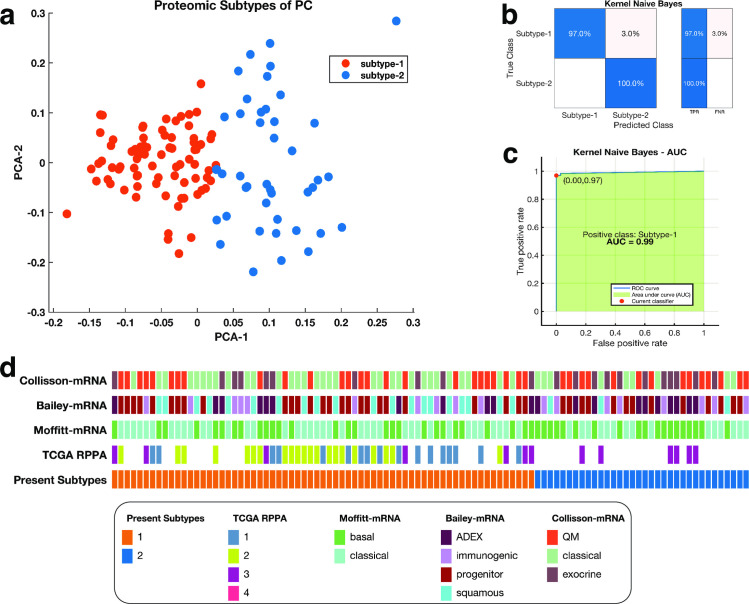
Fig 1.
(a) Clustering of pancreatic tumours; the first and second principal components of a PCA analysis are plots on the x-axis and y-axis response. The points are coloured according to the K-mean clustering defined cluster assignments. (b) a representative confusion matrix for the Kernel naïve Bayes classifier used to validate the clustering of the proteomic subtypes of pancreatic cancer. The blue cells correspond to samples that are correctly classified. The red cells correspond to incorrectly classified samples. In the plot, TFR shows the true-positive rate and TNR indicate the false-negative rate. (c) the Receiver operating characteristic Curve for the Kernel naïve Bayes. The green shaded area represents the area under the curve (AUC = 0.99). (d) Comparison between the current proteomic based classification of pancreatic cancers to other classification schemes from top to bottom: mRNA-based classification schemes established by Collisson et al.; Bailey et al.; and Moffitt et al., and the TCGA’s [23] RPPA classification scheme.

