Fig 2.
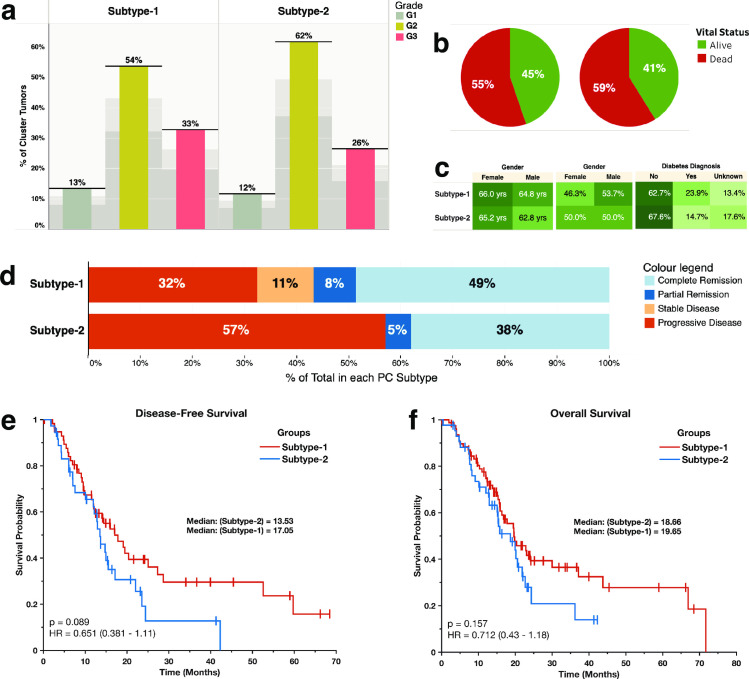
(a) Distribution of tumour grades across the proteomic subtypes: Showing the percentage of the total count of the number of tumours for each grade of tumour broken down by proteomic subtype. (b) Pie chart showing the vital statistics after the first course of treatment across the two disease subtypes. (c) Highlight tables showing the distribution of, from left to right: The study participants’ age, gender, and the diabetes diagnosis. (d) The clinical outcomes after the first course of treatment across the disease subtypes. (e) Kaplan-Meier curve of the disease-free survival months of patients afflicted by each pancreatic cancer subtype (f) Kaplan-Meier curve of the overall survival months of patients afflicted by each pancreatic cancer subtype.

