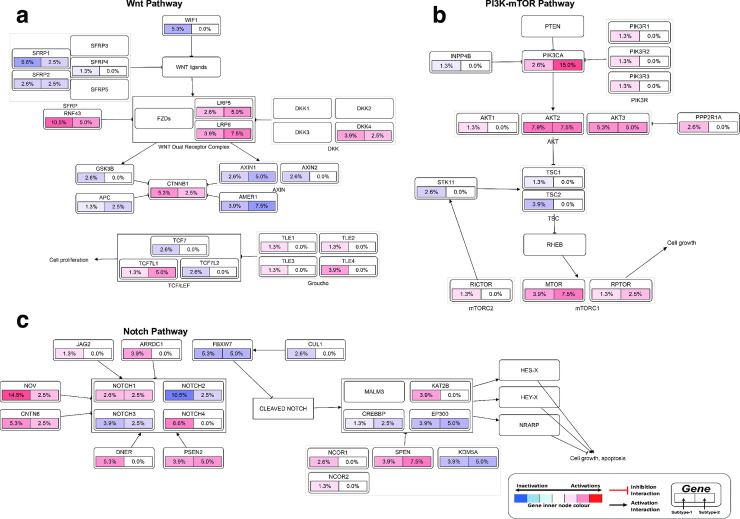
Fig 5.
Alterations in (a) Wnt pathway, (b) PI3K-mTOR pathway and (c) Notch pathway. The node represents the percentage of each gene mutation and copy number alterations of (left half) subtype-1 and (right half) of subtype-2 pancreatic tumours. The nodes are coloured according to the types of genes: Blue nodes for tumour suppressor genes and red for oncogenes. The interaction types are as given in the figure legend.

