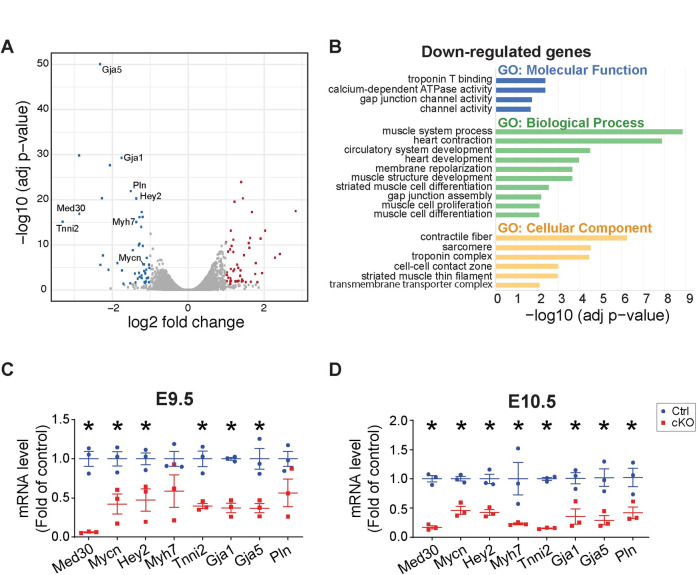
Fig 3. Transcriptome analysis in Med30 cardiomyocyte-specific knockout (cKO) and control (Ctrl) hearts.
(A) Volcano plot obtained from DESeq2 analysis of gene expression in Med30 cKO versus control hearts at E10.5. Genes with adjusted P<0.05 and log2 (fold change) >1 are considered significantly upregulated or downregulated genes in Med30 cKO hearts. The upregulated or downregulated genes are highlighted in red and blue, respectively. (B) Gene Ontology (GO) analysis of significantly downregulated genes in Med30 cKO hearts. (C, D) qRT-PCR validation of RNA-seq data in Med30 cKO (red) versus control (Ctrl) (blue) hearts at E9.5 (C) and E10.5 (D). Data were normalized to corresponding 18s levels, and cKO is expressed as the fold-change versus control. n = 3. Data are represented as the mean ± SEM. *P < 0.05, by 2-tailed Student’s t test.

