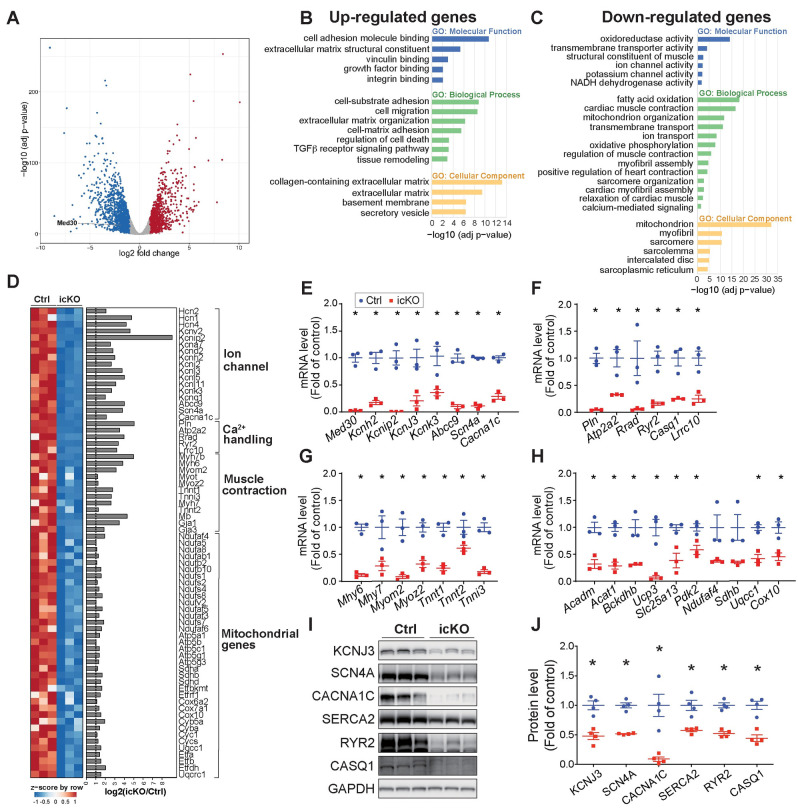
Fig 6. Transcriptome analysis in MED30 deletion adult cardiomyocytes.
(A) Volcano plot obtained from DESeq2 analysis of gene expression in adult cardiomyocytes isolated from Med30 icKO versus control hearts at 4 weeks post-tamoxifen injection. Genes with adjusted P<0.05 and log2 (fold change) >1 are considered significantly upregulated or downregulated genes in Med30 icKO cardiomyocyte. The upregulated or downregulated genes are highlighted in red and blue, respectively. (B-C) Gene Ontology (GO) analysis of significantly upregulated (B) and downregulated (C) genes in cardiomyocytes isolated from Med30 icKO at 4 weeks post-tamoxifen injection. (D) Heatmap (left) and bar graph of log2 (fold change) (right) for downregulated genes involved in ion channels, Ca2+ handling, muscle contraction and mitochondrial genes. (E-H) qRT-PCR validation of RNA-seq data for genes involved in ion channels (E), Ca2+ handling (F), muscle contraction (G), and mitochondrial genes (H), in adult cardiomyocytes isolated from Med30 icKO (red) versus control (Ctrl) (blue) at at 4 weeks post-tamoxifen injection. n = 3. (I, J) Representative immunoblots (I) and quantification analysis (J) of KCNJ3, SCN4A, CACNA1C, SERCA2, RYR2 and CASQ1 in adult cardiomyocytes isolated from Med30 icKO and control (Ctrl) hearts at 4 weeks post-tamoxifen injection. GAPDH served as a loading Ctrl. n = 3. All Data represent mean ± SEM. Statistical significance was based on student’s t test, *, P <0.05.

