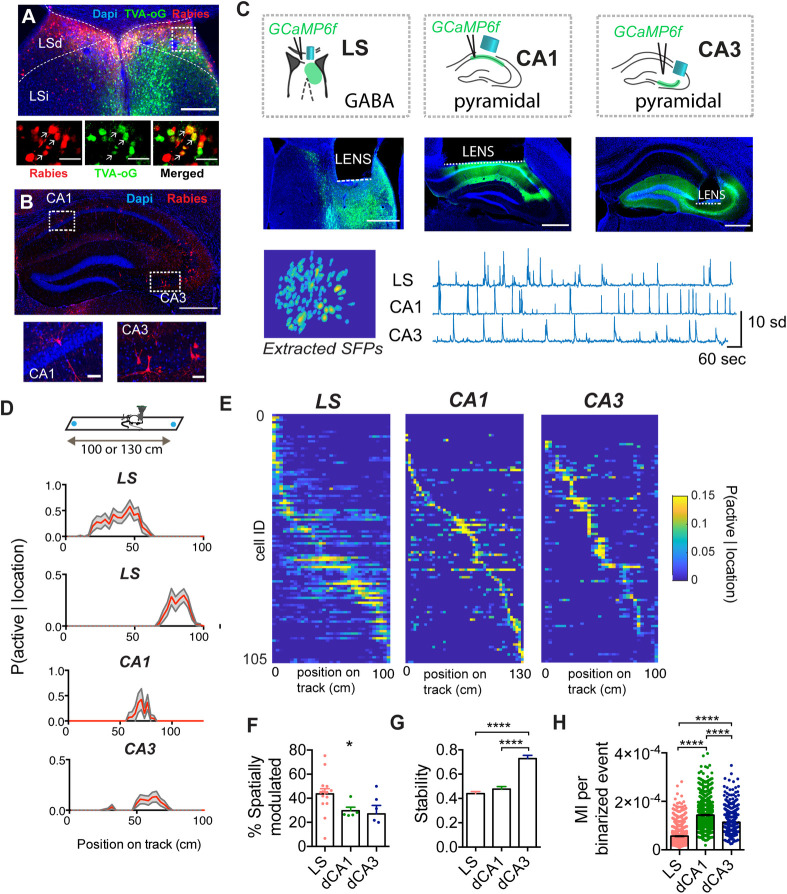
Fig 1. LS shares spatial coding characteristics with its main hippocampal inputs CA1 and CA3 during goal directed navigation in a 1D environment.
(A) Retrograde rabies tracing injection site, blue: DAPI staining, green: TVA.oG coupled to an eGFP, red: Rabies coupled to mCherry, orange: starter cells expressing both TVA.oG.eGFP and Rabies.mCherry. (B) Retrograde labeling in the dorsal hippocampus, coronal section. Bottom left: example of mCherry-positive CA1 pyramidal cell, bottom right: mCherry-positive CA3 pyramidal cells, blue: DAPI staining, red: Rabies coupled to mCherry. (For additional images, see S1 Fig). (C) Top: diagram of one-photon calcium recording setup in LS, CA1, and CA3 in freely behaving mice, with GCaMP6f expression restricted to GABAergic cells in LS and restricted to pyramidal cells in dorsal CA1 and CA3, middle: histological verification of implantation site (see also S2 and S3 Figs), and bottom: extracted calcium transients for LS, CA1, and CA3. (D) Top: linear track paradigm, with sucrose rewards on either end. Bottom: probability of an example cell to be active given the location on the linear track (red) with 95% upper and lower percentile (gray). Examples shown are from 2 different LS mice and a representative spatially modulated cell from one CA1 and CA3 animal each. (E) Activity of cells sorted along location in the maze for each region (blue, low; yellow, high). (F) Percent of significantly spatially modulated cells for each animal for each recording region. LS: N = 15 mice. CA1: N = 5 mice, N = 6 mice. (G) Within-session stability of spatially modulated cells in each region active (LS: n = 475 cells, CA1: n = 336 cells, CA3: n = 143 cells). (H) MI per binarized event for all cells (LS: n = 1,030 cells, n = 15 mice. CA1: n = 1251 cells, n = 5 mice, CA3: n = 464 cells, n = 6 mice). *, p < 0.05, **, p < 0.01, ****, p < 0.0001. Test used in F–H: Kruskal–Wallis with Dunn’s multiple comparisons test. The underlying data can be found in S1 Data. eGFP, enhanced green fluorescent protein; LS, lateral septum; LSd, dorsal lateral septum; LSi, intermediate lateral septum; MI, mutual information; SFP, spatial footprint.

