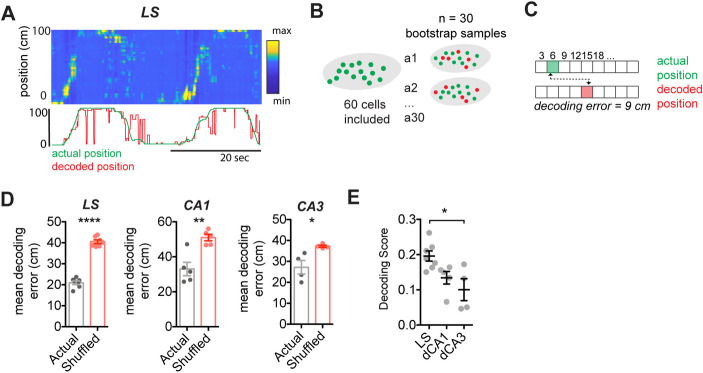
Fig 2. Location can be reliably decoded from LS GABAergic cells.
(A) Top: posterior probabilities for each frame estimated from binarized calcium activity; bottom: corresponding actual (green) and decoded (red) location. (B) Schematic representation of bootstrapping approach. (C) Method for computing mean Euclidean distance decoding error (in cm) for each bootstrapped estimate. (D) Decoding error for actual vs shuffled dataset (30 bootstrapped samples of 60 cells, LS: N = 7 mice, CA1: N = 5 mice, CA3: LS = 4 mice). (E) Mean decoding score for each region. *, p < 0.05, **, p < 0.01, ****, p < 0.0001. Test used in D, paired t test, E, one-way ANOVA, Holm–Sidak’s multiple comparisons test. The underlying data can be found in S1 Data. LS, lateral septum.

