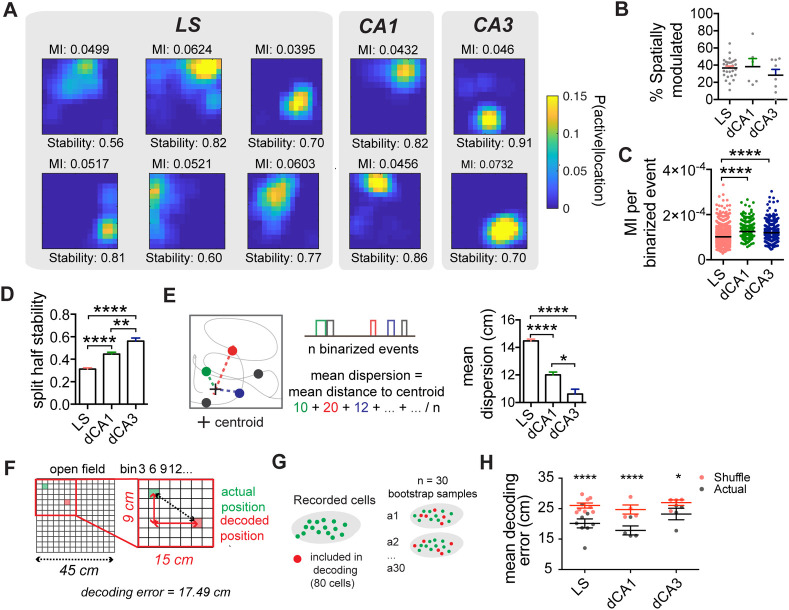
Fig 3. LS shares spatial coding characteristics with its main hippocampal inputs CA1 and CA3 during free exploration in a 2D environment.
(A) Example tuning maps of spatially modulated cells recorded from LS, dorsal CA1, and dorsal CA3 in a 45 × 45 cm open field (3 × 3 cm bins). (B) Proportion of spatial cells per animal (LS: n = 28 mice; dCA1: n = 6 mice; dCA3: n = 8 mice). (C) MI (bits) per binarized event for all cells recorded from each region (LS: n = 1,899 cells from n = 28 mice; dCA1: n = 1,031 cells, n = 6 mice; dCA3: n = 534 cells, n = 8 mice). (D) Within-session stability for spatial cells (LS: n = 734 spatial cells from n = 28 mice; dCA1: n = 424 spatial cells, n = 6 mice; dCA3: n = 138 spatial cells, n = 7 mice). (E) Left: mean dispersion computation. Right: mean dispersion for all spatial cells recorded from each region. (F) Method for computing the mean decoding error. (G) Bootstrapping approach using 80 randomly selected cells, for 30 bootstrapped samples. (H) Mean decoding error for LS (n = 8 mice), CA1 (n = 4 mice), and CA3 (n = 4 mice). *1, p < 0.05, **, p < 0.01, ****, p < 0.0001. Test used in B, one-way ANOVA, C–E, Kruskal–Wallis, Dunn’s multiple comparison test, H, two-way ANOVA, Sidak’s multiple comparisons test. The underlying data can be found in S1 Data. LS, lateral septum; MI, mutual information.

