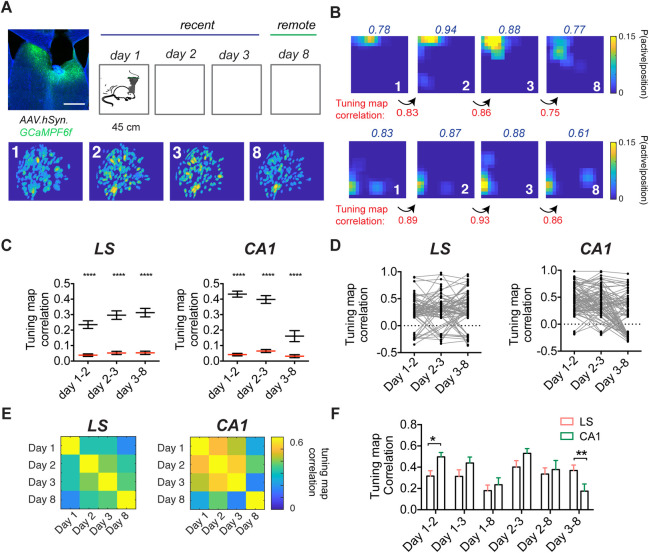
Fig 4. LS place code remains similar to CA1 over longer periods of time.
(A) Experimental setup (top) with a representative example of an animal implanted in the LS and aligned spatial footprints of cells recorded over days (bottom). (B) Tuning maps for 2 sets of stable cells recorded over all days, with each row being one aligned cell. Within-session correlation indicated in blue. Tuning map correlation indicated at the bottom in red. (C) Significant tuning map correlation for aligned cell pairs (black) vs. shuffled pairs (red) for progressive days for LS (day 1–2, n = 157 cells; day 2–3, n = 122 cells; day 3–8, n = 129 cells; n = 5 mice) and dorsal CA1 (day 1–2, n = 165 cells; day 2–3, n = 122 cells; day 3–8, n = 99 cells; n = 3 mice). (D) Significant tuning map correlations for all cells found on all days for LS (n = 84) and CA1 (n = 86). (E) Matrix of mean tuning map correlation for all aligned cells that were significantly spatially modulated on each day, for LS (n = 23–37 cells, n = 5 mice) and CA1 (n = 23–41 cells, n = 3 mice). (F) Mean tuning map correlation for data shown in E. *, p < 0.05, **, p < 0.01, ****, p < 0.0001. Test used in C, two-way ANOVA, with Sidak’s multiple comparisons test, F, two-way ANOVA, with Fisher’s LSD post hoc test. The underlying data can be found in S1 Data. LS, lateral septum.

