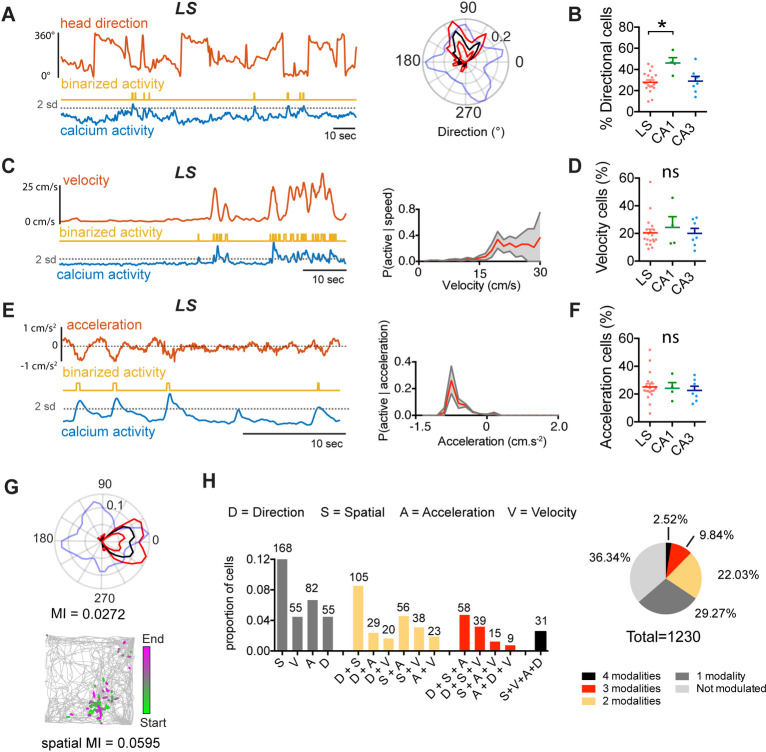
Fig 5. LS GABAergic cells encode direction, speed, and acceleration.
(A) Left: activity of an example LS neuron during free exploration in an open field; top: HD (red); middle: binarized activity (yellow); bottom: raw calcium activity (blue). Right: corresponding polar plot indicating the probability of the cell being active as a function of the animals’ HD with (black, p(active | direction); red lines indicate 95% upper and lower percentile. Blue line indicates the normalized time spent for each direction. MI calculated using 40 bins of 9° (S15 Fig). (B) Proportion of significantly directionally modulated cells in LS, dCA1, and dCA3. (C) Left: activity of an example LS neuron during free exploration modulated by velocity (top, red); middle: binarized activity (yellow); bottom: raw calcium activity (blue). Right: Tuning curve for velocity for the example cell (red) with 95% upper and lower percentile in gray. MI calculated using 20 bins. (D) Proportion of significantly speed modulated cells in LS, dCA1, and dCA3. (E) Left: activity of an example LS neuron during free exploration modulated by acceleration (top, red); middle: binarized activity (yellow); bottom: raw calcium activity (blue). Right: Tuning curve for acceleration for the example cell (red) with 95% upper and lower percentile in gray. MI calculated using 20 bins. (F) Comparison of proportions of significantly modulated cells for each region. (G) Example of an LS cell that is both significantly head direction modulated (left), as well as spatially modulated (right). (H) Left: proportion of cells that are significantly modulated by only one modality (gray), 2 modalities (yellow), 3 (red) or all 4 of the investigated variables (black). The number above the bars indicates the absolute number of cells found to be modulated in the total population (n = 1,230 cells, n = 19 mice). Right: absolute proportion of cells modulated by any combination of variables. Test used in B, D, F: Kruskal–Wallis test with Dunn’s multiple comparisons test. *, p < 0.05. The underlying data can be found in S1 Data. A, acceleration; D, direction; HD, head direction; LS, lateral septum; MI, mutual information; ns, not significant; S, spatial coding; V, velocity.

