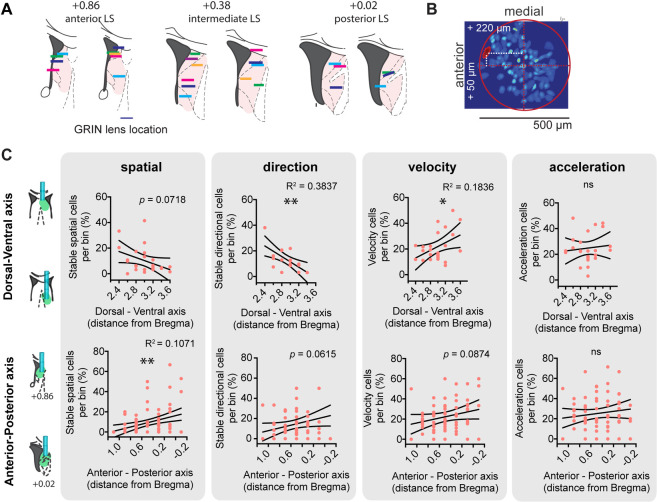
Fig 7. LS cells coding for space, direction, and self-motion correlates are nonuniformly distributed along the dorsal–ventral and anterior–posterior axis.
(A) Strategy to record from different anterior–posterior levels in LS (left) and implantation sites covered. (B) Strategy to approximate cell location. Background: maximal projection of representative recording; red: outline of approximated GRIN lens position; white: distance from the center of the GRIN lens to the cells of interest. (C) Top: for 0.2 mm bins along dorsal–ventral axis, proportion of stable (within-session stability > 0.5) spatially modulated cells (n = 24 mice), directionally modulated cells (n = 17 mice), velocity cells (n = 24 mice), and acceleration cells (n = 24 mice), respectively. Bottom: same as top for anterior–posterior axis. Each red dot represents the average per animal per bin along the anterior–posterior axis (left) and along the dorsal–ventral axis. Black lines indicate 95% confidence intervals. *, p < 0.05, **, p < 0.01. Test used in C: linear regression. The underlying data can be found in S1 Data. GRIN, gradient refractive index; LS, lateral septum; ns, not significant.

