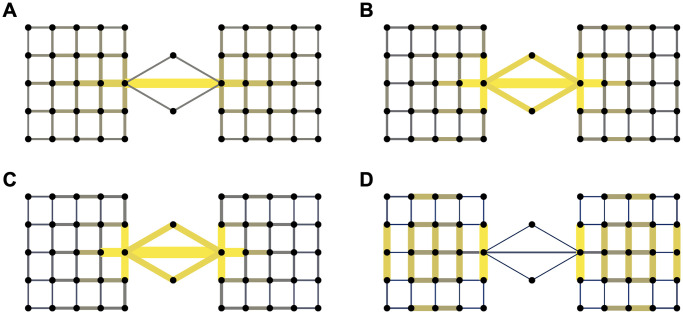
Fig 1. Edge-betweenness measures.
Colour intensities and edge widths are chosen to reflect relative magnitude of betweenness measures. Yellow and thick edges have high betweenness scores, dark grey and thin edges have low betweenness scores. (A) The SP betweenness. It fails to identify the upper and lower “bridge” as important global bottleneck edges. (B) The CF betweenness. (C) The LF betweenness with λ = 1. It is almost identical to the CF betweenness. (D) The LF betweenness with λ = 2/5. It completely ignores the global bottleneck “bridges” and turns attention to edges within each block.

