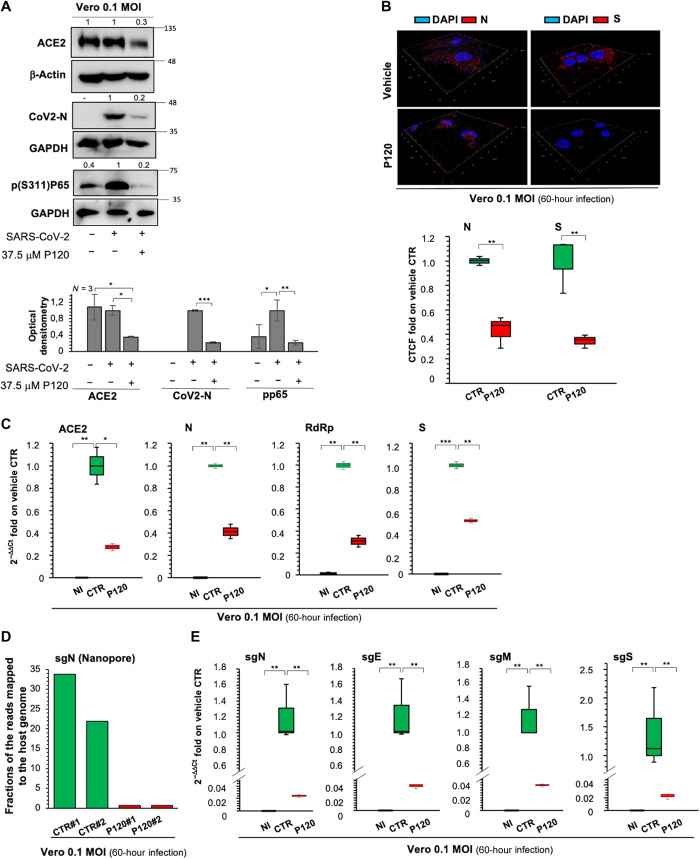
Fig. 4. Antiviral action of polyP120 in Vero E6 cells.
(A) Top: Representative Western blotting analysis (with antibodies against the indicated proteins) of Vero E6 cells (8 × 10⁵) infected with Italian SARS-CoV-2 viral particles (MOI, 0.1) for 24 hours and then treated with 37.5 μM polyP120 or vehicle for a further 36 hours. All experiments were performed in triplicate. Bottom: Densitometry analysis of the indicated band intensities on blots from three independent experiments. Data are means ± SD. *P < 0.05, **P < 0.01, and ***P < 0.001 by unpaired two-tailed Student’s t test; n = 3 independent experiments per group. Negative controls: noninfected (NI) cells and SARS-CoV-2–infected cells treated with vehicle (CTR). GAPDH, glyceraldehyde-3-phosphate dehydrogenase. (B) Representative three-dimensional IF reconstruction (top) and its quantification (bottom) with antibodies against the SARS-CoV-2 N and S proteins for cells treated as described for (A). Magnification, ×63. Fluorescence intensity was measured in each cell and compared with that in the vehicle control. More than 50 cells were counted. Quantification is presented as the corrected total cell fluorescence (CTCF) intensity. (C) Quantification of mRNA abundance relative to that in CTR cells (2−ΔΔCt) for ACE2 and genomic viral RNAs (N, RdRp, and S) from RT-PCR analysis with SYBR Green of total RNA extracted from cells treated as described for (A). Noninfected and SARS-CoV-2–infected cells treated with vehicle (CTR) were used as controls. Data are means ± SD. *P < 0.05, **P < 0.01, and ***P < 0.001 by unpaired two-tailed Student’s t test, adjusted with the Bonferroni method; n = 3 independent experiments per group. (D) Quantification of direct RNA sequencing reads (through Nanopore technology) assigned to the sgN transcript expressed as fractions of reads mapped to the host genome. Two independent experiments are shown (#1 and #2; SRA data accession: PRJNA688696). (E) Quantification of mRNA abundance relative to that in CTR cells (2−ΔΔCt) of subgenomic (sg) viral RNAs from the RT-PCR analysis with SYBR Green of cells treated as described for (A). Noninfected cells and SARS-CoV-2–infected cells treated with vehicle (CTR) were used as controls. Data are means ± SD. **P < 0.01 by unpaired two-tailed Student’s t test, adjusted with the Bonferroni method; n = 3 independent experiments per group.

