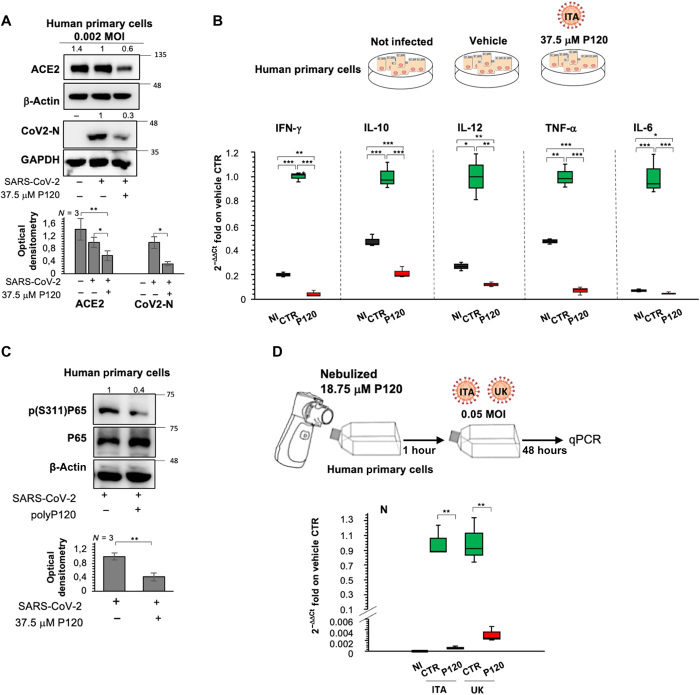
Fig. 5. Antiviral actions of polyP120 in human cell lines result in decreased cytokine production.
(A) Top: Representative Western blotting analysis (using antibodies against the indicated proteins) of human epithelial cells (4.25 × 10³) infected with Italian SARS-CoV-2 (MOI, 0.002) for 24 hours and then treated with 37.5 μM polyP120 or vehicle for a further 36 hours. All experiments were performed in triplicate. Bottom: Densitometry analysis of the indicated band intensities on blots from three independent experiments. Data are means ± SD. *P < 0.05 and **P < 0.01 by unpaired two-tailed Student’s t test; n = 3 independent experiments per group. Negative controls: noninfected cells and SARS-CoV-2–infected cells treated with vehicle (CTR). (B) Quantification of mRNA abundance relative to that in CTR cells (2−ΔΔCt) for IFN-γ, IL-10, IL-12, tumor necrosis factor–α (TNF-α), and IL-6 from RT-PCR analysis with SYBR Green of RNA extracted from cells treated as described for (A). Noninfected cells and SARS-CoV-2–infected cells treated with vehicle (CTR) were used as controls. Data are means ± SD. *P < 0.05, **P < 0.01, and ***P < 0.001 by unpaired two-tailed Student’s t test, adjusted with the Bonferroni method; n = 3 independent experiments per group. (C) Top: Representative Western blotting of the primary human epithelial cells from nasal brushing treated as described for (A) with antibodies against the indicated proteins. All experiments were performed in triplicate. Bottom: Densitometry analysis of the indicated band intensities on blots from three independent experiments. Data are means ± SD. **P < 0.01 by unpaired two-tailed Student’s t test; n = 3 independent experiments per group. (D) Top: Experimental plan. Primary human epithelial cells from nasal brushing were plated in flasks and treated with nebulized 18.75 μM polyP120. After 1 hour, the cells were infected with 20A (EPI_ISL_514432-S66) or 20I/501Y.V1 (B.1.1.7) (UK) (EPI_ISL_736997) SARS-CoV-2 viral particles (MOI, 0.05), and noninfected cells were used as the negative control for infection. After 48 hours, the cells were lysed and their RNA was extracted. Bottom: Quantification of mRNA abundance relative to that in CTR cells (2−ΔΔCt) of N from RT-PCR analysis with SYBR Green. Noninfected cells and SARS-CoV-2–infected cells treated with vehicle (CTR) were used as controls. Data are means ± SD. **P < 0.01 by unpaired two-tailed Student’s t test, adjusted with the Bonferroni method; n = 3 independent experiments per group. qPCR, quantitative PCR.

