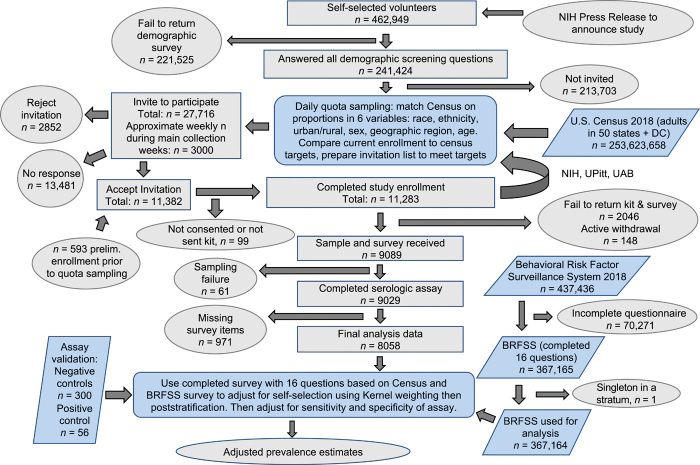
Fig. 1. SARS-CoV-2 serosurvey study overview and statistical workflow.
A flow chart of participant recruitment through data analysis displays steps in data acquisition and lists participant attrition. Ovals show the start and end of data analysis or data acquisition; gray rectangles indicate subsets of participants in this study; blue parallelograms represent individuals from outside data sets that contributed to adjusted prevalence estimates; blue rounded rectangles present analysis processes.

