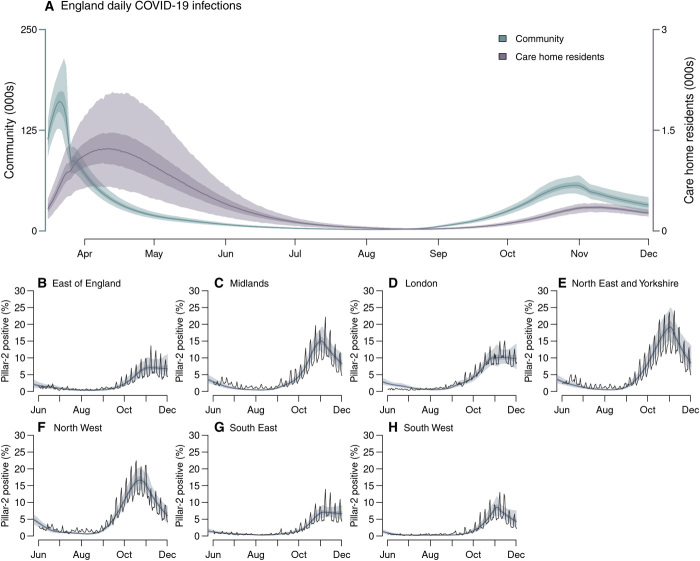
Fig. 2. Infection incidence and case positivity over time.
(A) Inferred daily SARS-CoV-2 infections in England care home residents (excluding care home workers; right axis) and the wider community (left axis). (B to H) Comparison of modeled (shaded bands) and observed (solid line) proportion of PCR tests that were positive under pillar-2 testing (community swab testing for symptomatic individuals) in >25-year-olds. Shaded bands depict 95% CrI, 50% CrI, and median model outputs.

