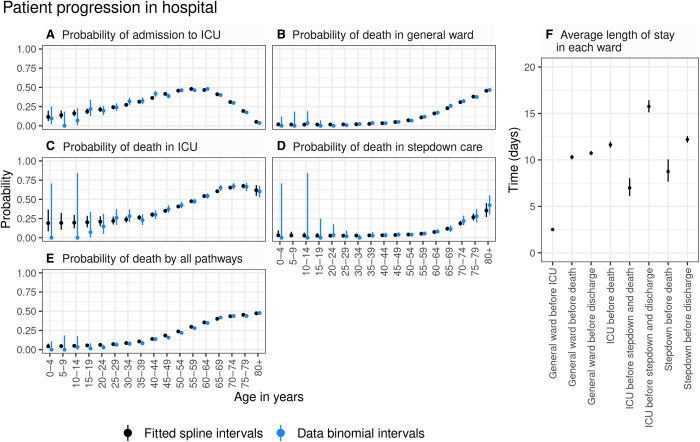
Fig. 3. Age-dependent probabilities of progression through hospital pathways.
(A) Probability of admission to ICU. (B) Probability of death in a general hospital ward. (C) Probability of death in an ICU. (D) Probability of death in hospital during stepdown care. (E) Probability of death through all hospital pathways [obtained by combining (B) to (D) using the branching structure shown in fig. S4]. Black circles and vertical segments show the posterior mean and 95% CrI of splines fitted to data, and blue circles and vertical segments show raw data mean values and 95% confidence intervals (exact binomial) for each 5-year age group. (F) Average estimated length of stay in each ward (posterior mean and 95% CrI).

