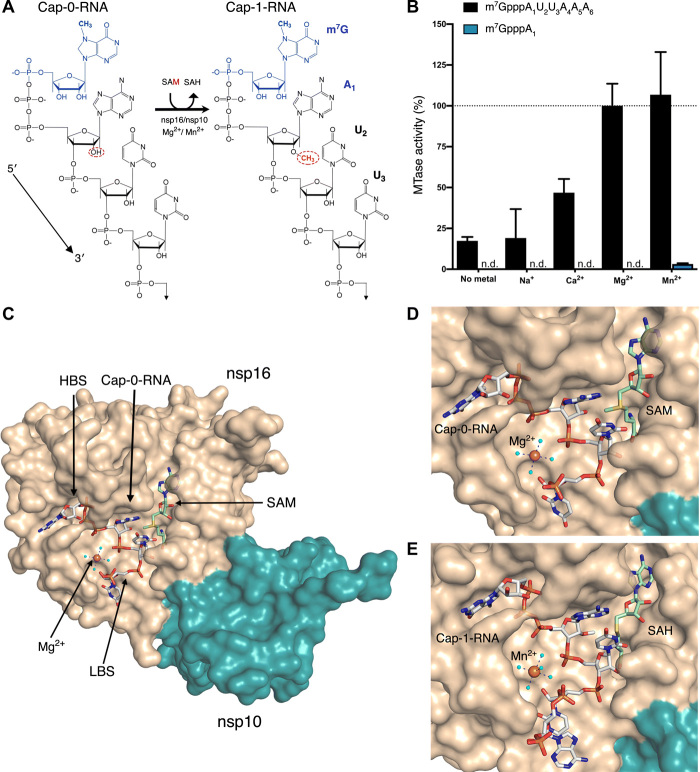
Fig. 1. Metal ions catalyze 2′-O-methyl transfer and orient the Cap-0-RNA in the active site.
(A) Schematic representation of the 2′-O-methyl transfer reaction generating Cap-1-RNA from Cap-0-RNA. The methylated guanosine cap (m7G) moiety is colored in blue, and the methyl group added to the A1 2′-OH position from the methyl donor SAM is in red. The remainder of the RNA structure with the first three labeled ribonucleotides is in black. (B) MTase-Glo luminescence assay results for Cap-0-RNA (m7GpppAUUAAA) and Cap-0 analog (m7GpppA) as substrates. n.d., no activity detected. The nsp16-nsp10 activity with Cap-0-RNA, SAM, and Mg2+ was selected as a reference (100%), and all measured activities were normalized to this value. All values are means ± SD for biological triplicates conducted in two separate experiments using two independent preparations of nsp16-nsp10 (n = 6). (C) The overall view of nsp16-nsp10 in complex with Mg2+, Cap-0-RNA, and SAM, (PDB 7JYY). The high-affinity binding site (HBS) and the low-affinity RNA binding (LBS) are labeled. (D and E) Close-up views of nsp16-nsp10 in complex with (D) Mg2+, Cap-0-RNA, and SAM (PDB 7JYY) or with (D) Mn2+, Cap-1-RNA, and SAH (PDB 7L6R). The nsp16 and nsp10 proteins are represented as solvent-exposed surfaces in tan and teal, respectively. Capped RNAs, SAM, and SAH are shown as sticks. Carbons are in gray for capped RNAs and in green for SAM and SAH; oxygens are in red; nitrogens are in blue; phosphates are in orange; sulfur is in yellow. Metal ions are shown as large spheres colored in purple for Mg2+ and orange for Mn2+. Water molecules are small, cyan spheres. Hydrogen bonds between metal ions and waters from the first hydration sphere are shown as black dashed lines.

