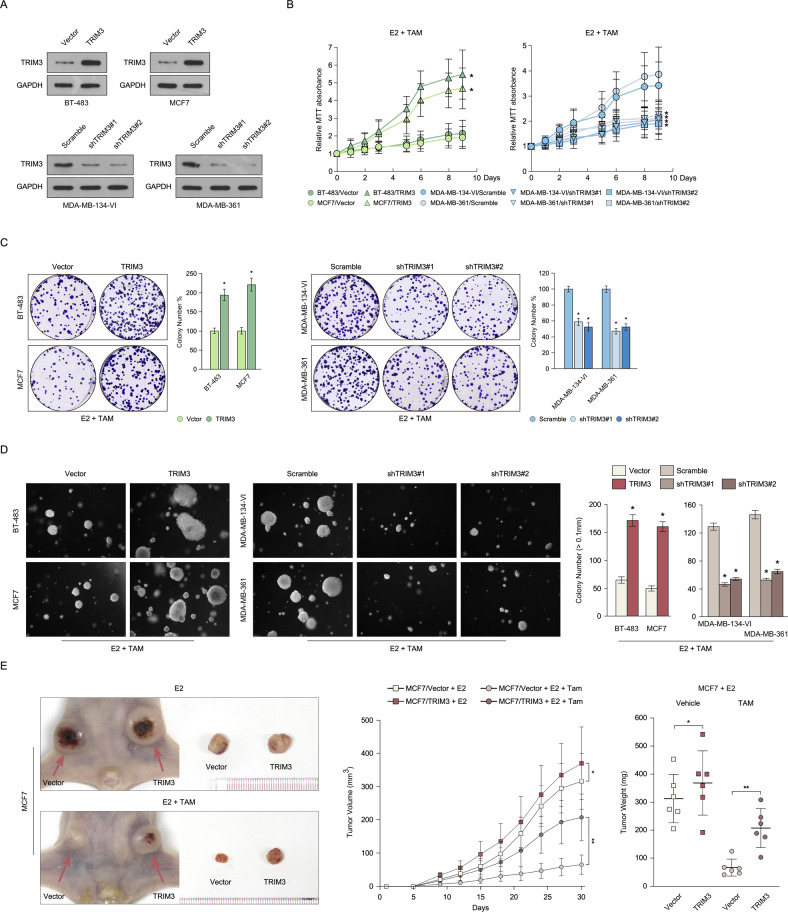
Fig. 2. TRIM3 contributes to tamoxifen resistance in breast cancer.
A Western blotting analysis of TRIM3 levels in the indicated breast cancer cell lines stably overexpressing TRIM3 and silencing for TRIM3. Cell viability was measured using MTT (B) and colony formation (C) assays in the indicated cell lines treated with E2 (10 nM) and TAM (1 μM). Statistical data are presented as the mean ± SD. D Soft agar assay of the indicated cells treated with E2 (10 nM) and TAM (1 μM) (left panel) and the statistical significance of colony formation was assessed in the right panel. Data are presented as the mean ± SD. P < 0.05. E Representative images of the tumors in the xenografts (left panel). Tumor growth curves (middle panel) and tumor weight (right panel) of the indicated xenograft tumors (n = 6/group). Data are presented as the mean ± SD. *P < 0.05, **P < 0.01.

