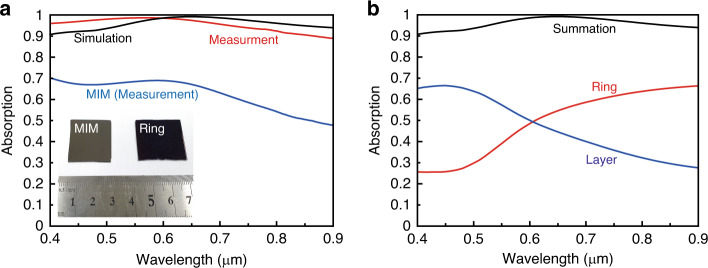
Fig. 3. Absorption spectrum and the total power dissipation density.
a Simulated (black line) and measured (red line) absorption spectra of ring-shaped absorber and measured absorption spectrum of metal–insulator–metal (MIM) structure (blue line) for comparison. Inset: photographs of fabricated absorbers. b The total power dissipation density of top ring-shaped TiN nanostructure array (red line), bottom TiN layer (blue line) to examine absorption contribution of two TiN layers. The summation of two dissipation densities (black line) is equal to the simulated absorption spectrum

