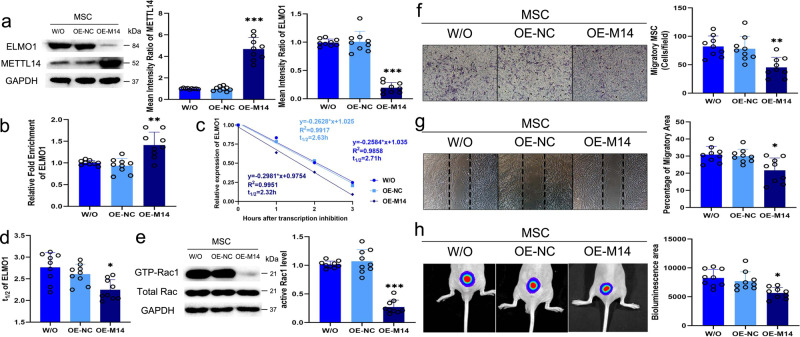
Fig. 8. METTL14 overexpression downregulates ELMO1 levels and inhibits MSC directional migration.
a METTL14 expression in MSC was increased and ELMO1 expression was inhibited in the OE-M14 group (n = 9) compared to the control group (n = 9; P = 1.3363E−11, 8.9609E−13) and OE-NC group (n = 9; P = 1.2451E−11, 7.4978E−13). b The m6A modification level of ELMO1 mRNA in OE-M14 group (n = 9) was higher than that of control group (n = 9; P = 0.001) and OE-NC group (n = 9; P = 0.000092). c, d The degeneration rate of ELMO1 mRNA was elevated by OE-M14 group (n = 9) than OE-NC group (n = 9; P = 0.029). e The active Rac1 level in MSC (n = 9) was significantly lower in OE-M14 group (n = 9; P = 1.3512E−10) than the OE-NC group (n = 9; P = 2.0426E−11). f The number of stained migratory MSC in OE-M14 group (n = 9) was lower than that of control group (n = 9; P = 0.001) and OE-NC group (n = 9; P = 0.005). g The migratory area of the OE-M14 group (n = 9) was smaller compared to that of control group (n = 9; P = 0.005) and OE-NC group (n = 9; P = 0.011). h The bioluminescence area of nude mice in the OE-M14 group (n = 9) was lower than that of mice in the control group (n = 9; P = 0.002) and the OE-NC group (n = 9; P = 0.013). Data were analyzed using one-way ANOVA followed by Bonferroni’s post hoc comparisons. Values are presented as the mean ± SD. * Indicates P < 0.05, ** indicates P < 0.01, and *** indicates P < 0.001. W/O indicates MSC without lentivirus transfection. OE-NC indicates MSC transfected with control lentiviruses. OE-M14 indicates MSC transfected with lentiviruses overexpressing METTL14.

