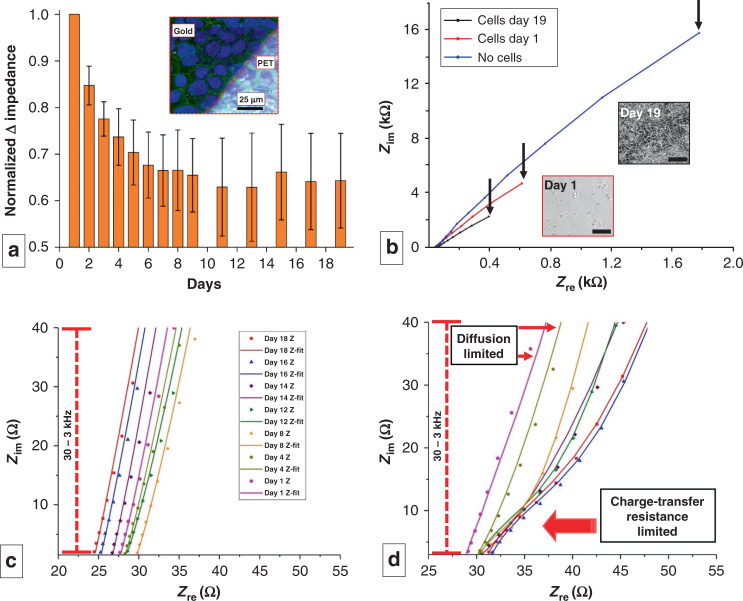
Fig. 3. Impedimetric analysis of cell culture on IDEs.
a Normalized change in impedance values measured at 10 Hz over the course of 19 days (n = 3 measurements from separate devices). The inset shows the endpoint (day 19) fluorescence micrograph of the cell-covered sensor surface superimposed on the brightfield image of the sensor. The dark area denotes the area covered by the Au electrode, and the bright area corresponds to PETE. b Nyquist plot showing the impedance at 3 stages of cell culture. The black arrows indicate impedance at 10 Hz. Insets show the phase contrast image of the triculture on day 1 and day 19 (Scale bar: 100 µm). c, d Zoomed in Nyquist plots for c control device with no cells and d device with cell culture. The latter indicates the transition of the system from a diffusion-limited state to a charge transfer-limited state as the culture progresses. (dots = raw data, line = fitting with model on Supplementary Fig. S2). c, d Share the same legend

