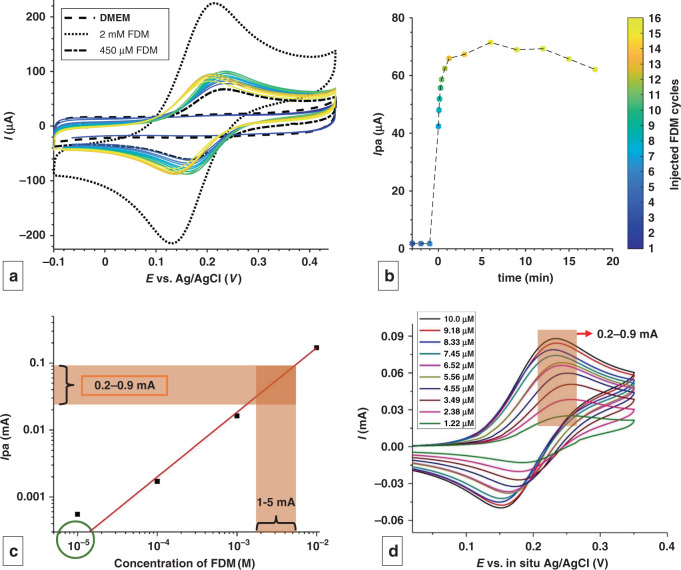
Fig. 4. Electrochemical sensing of a model redox molecule through flexible and porous CV electrodes.
a CV demonstrating the diffusion of FDM through the pores in real time, with peak height proportional to the local FDM concentration. Scan rate = 300 mV/s, 3.7s/cycle. b Evolution of anodic peak current (Ipa) vs time. c Calibration plot for FDM in DMEM + 10% FBS in the porous CV sensor. The concentration corresponding to the Ipa values measured from d is shown by the brown trace in c. The experimental bulk concentration in the bottom chamber is marked by the green circle in c. d CV following the addition of 10 aliquots of 100 μL of 10 mM FDM. The legend displays the final bulk concentration

