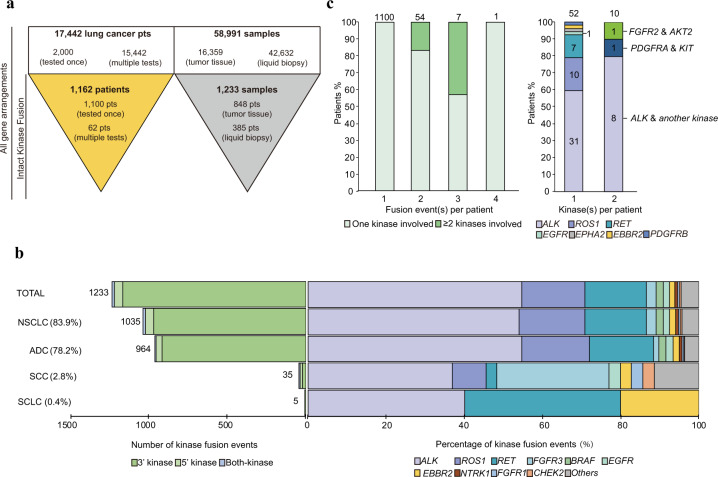
Fig. 1. Overview of kinase fusions in lung cancer patients.
a Pipeline for kinase fusion calling and filtering. b The left bar plot shows the distribution of the three kinase fusion categories in different lung cancer subtypes. The number of events in each condition is indicated to the left of each bar. The right bar plot shows the percentage of the kinase genes involved across different lung cancer subtypes. c The left bar graph shows the number of kinase fusions in one patient. The right bar graph shows the kinase genes of patients who carried more than one kinase fusion. The number of patients in each condition is indicated on the top of each bar.

