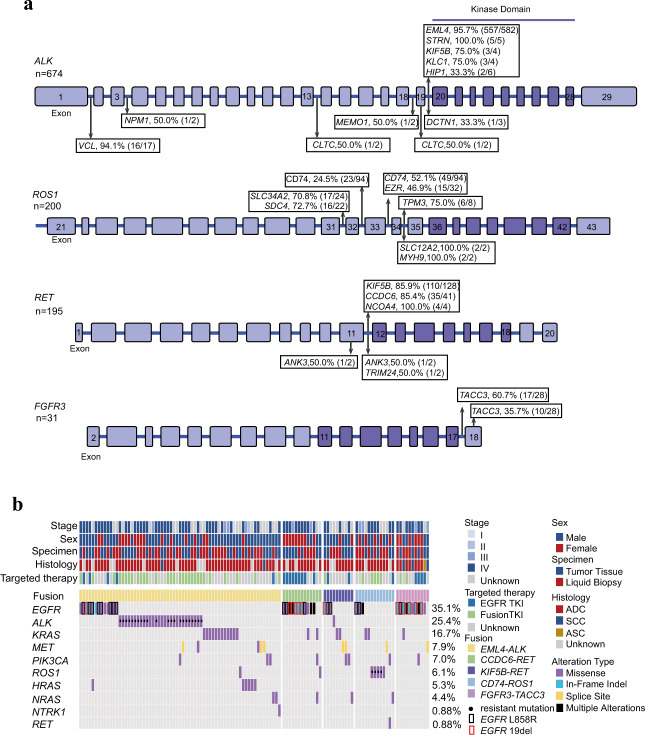
Fig. 3. The breakpoint locations for kinase genes and druggable driver mutations co-occurring with kinase fusions.
a The breakpoints for ALK with different partners; the breakpoints for ROS1 with different partners; the breakpoints for RET with different partners; the breakpoints for FGFR3 with different partners. The partners shown above the structure of each kinase belong to common partners. Some rare partners are shown under the kinase structure. The number of events involving each of the four kinases is shown to the left of each kinase structures. The percentage breakpoints with each partner, the number of events for each fusion in specific kinase breakpoints, and the total number of events for each fusion are shown. b The co-occurrence of kinase fusions and driver mutations is displayed in the hotspot plot. The incidences of driver gene mutations are shown to the left of the plot. Tissue/plasma samples were collected from 59 patients after developing resistance to EGFR TKI or fusion targeted treatment.

