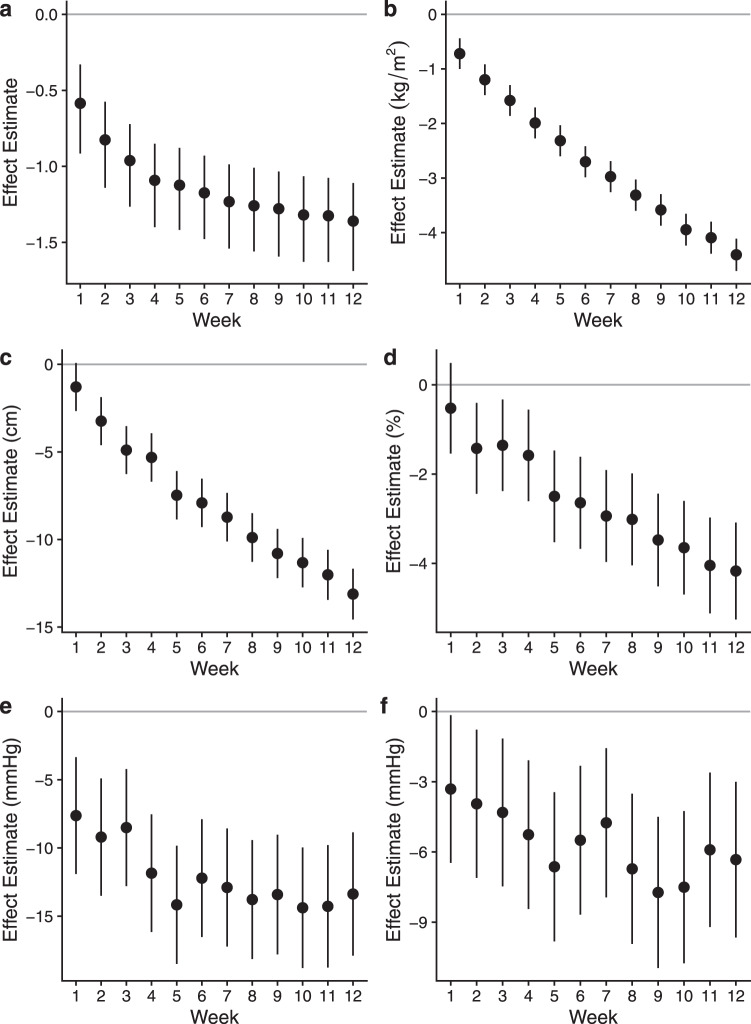
Fig. 2. Descriptive analysis of weekly data collected in the Pharm-TCR group.
Data are weekly effect estimates for changes from baseline (Week 0; gray line) with confidence intervals in the Pharm-TCR group for (a) medication effect score (MES); (b) body mass index; (c) waist circumference; (d) body fat percentage; (e) systolic blood pressure; and (f) diastolic blood pressure. Values are effect estimates for adjusted mean change from baseline in a–f. Bias-adjusted and accelerated confidence intervals derived from non-parametric bootstrap analysis are presented in panel a. Error bars for panels b–f represent 95% confidence intervals. Data are based on participants for which baseline data were collected (n = 92) except for waist circumference (n = 90) and body fat percentage (n = 91). Source data are provided as a source data file.

