
Fig. 5. A comparison of the analytical performance of ELISAs and the equivalent E-DNA sensors indicates that, due to the amplification provided by enzymatic signal generation, the detection limits of the latter are an order of magnitude lower than those of the former.
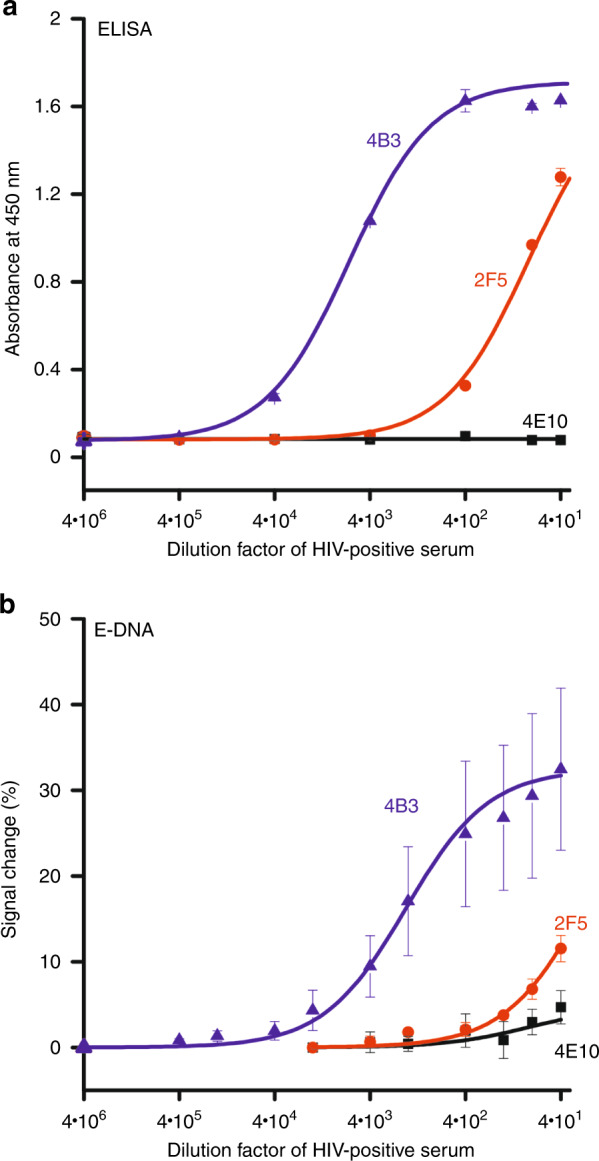
The data shown are averaged results obtained using either three wells (for ELISA) or three independently fabricated electrodes (for E-DNA sensors) for each sample dilution, with the error bars representing standard deviations of these measurements. a ELISA results: epitope 4B3 produced a useful dynamic range (defined here as the transition from 10 to 90% of the saturated signal) starting at a titer of 1:72,000 and epitope 2F5 a useful dynamic range starting at a titer of 1:960. A sensor displaying epitope 4E10, in contrast, did not respond at any dilution. b E-DNA results: epitope 4B3 produced a useful dynamic range starting at titers of 1:14,400 and epitope 2F5 at a titer of 1:40, indicating the ability of the E-DNA scaffold sensors to detect also anti-2F5 antibodies albeit only at higher serum concentrations than those employed above (Fig. 3). A sensor employing 4E10 did not respond at any dilution. The variability in the E-DNA sensor response at low dilution is due to sensor variation seen at high concentrations of serum proteins. Due to the five washing steps (using PBS + 0.05% tween20) they employ, ELISAs are more resistant to such effects.