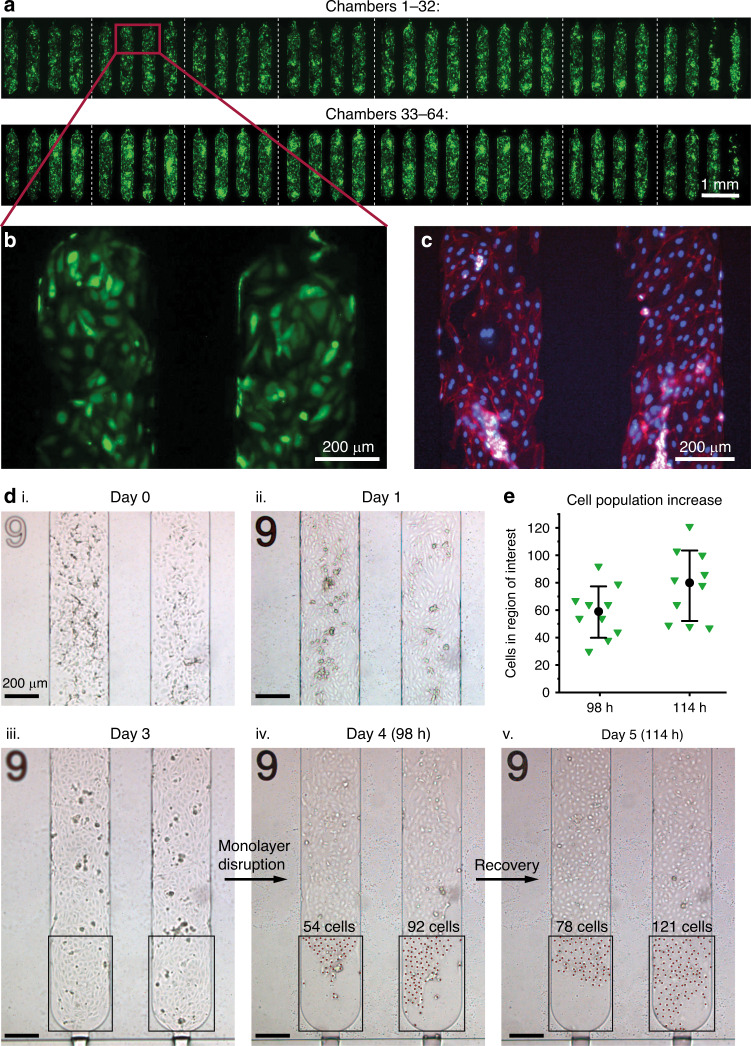
Fig. 7. Proof-of-principle HUVEC culture in an unmounted mLSI MFBB.
a Live-cell fluorescence images (one image per four chambers) showing an overview of all the chambers after 3 days of culturing GFP-expressing HUVECs. b Live-cell fluorescence image of GFP-expressing HUVECs in chambers 6 and 7. c Fluorescence image of fixed HUVECs with the cell F-actin and nuclei stained with ActinRed and NucBlue, respectively. d HUVECs after seeding and subsequent monolayer formation. The cells were seeded at a high cell density (i) and confluent on day 1 (ii). The monolayer was still intact on day 3 (iii) but began to deteriorate on day 4 (iv). At this point, the medium in the supply vial was replaced. The cells showed signs of recovery on day 5 (v) as the monolayer started to reform. The red dots in (iv) and (v) mark the cells counted in the region of interest. e Cells in ten chambers were counted in regions where the monolayer had deteriorated on day 4 (98 h) and after 16 h of recovery (114 h). The black dots represent the mean cell count, and the error bars represent the standard deviation. The cell number increased by an average of 33% in these areas

