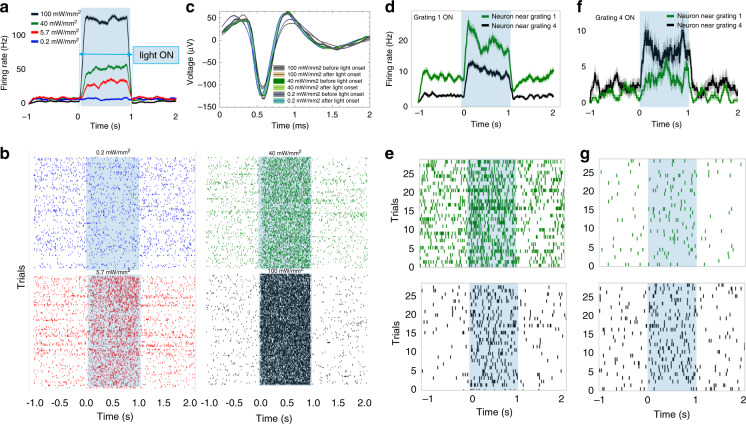
Fig. 6. In vivo recording and simultaneous optogenetic excitation experiment performed in a mouse expressing the ChR2 opsin.
a Firing rate of a neuron before, during, and after light excitation at different intensities, and b corresponding raster plots. The firing rate increases proportionally for intensities above ~5.7 mW/mm2 (n = 100 trials, mean ± sem). c Mean waveforms of the neuron of (a, b) before and after light onset for different grating output intensities, showing no changes in the waveform amplitude or shape. d–f Excitation of neurons in different spatial locations based on the activated light output grating. Firing rates of two units (d, f) and corresponding raster plots (e, g) when either grating 1 or grating 4 is on (n = 30 trials, mean ± sem)

