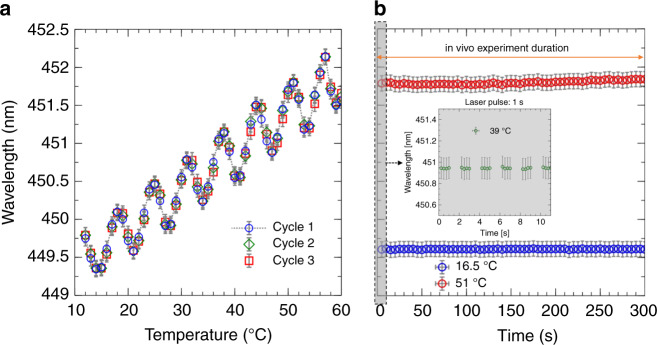
Fig. 7. Laser diode temperature-wavelength calibration curve.
a Output wavelength as a function of the temperature of the laser diode. Three different temperature cycles from 12 to 60 °C are reported (blue circles, green diamonds, and red squares correspond to the three cycles). b Output wavelength (same axis as in a) as a function of time over a 5 min interval, reported for two different temperatures, namely, 16.5 °C (blue circles) and 51 °C (red circles). The inset shows a similar recording of the output wavelength for a set temperature of 39 °C (green circles) during a 10 s time interval to show that the wavelength is stable over the 1 s period of the laser pulse during the experiment

