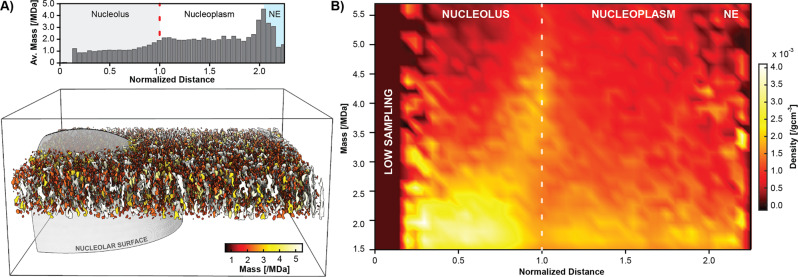
Fig. 2. Image-based analysis of the nucleolar organization.
A Individual tomograms can be denoised50 and filtered to allow segmentation of nuclear particles (bottom). Analysis of their apparent mass (top) shows an increase in apparent mass per particle toward the surface of the nucleolus starting at ~0.75 of the normalized distance. Before and after that, the average mass remains relatively constant until the nuclear envelope is reached. B Spectral analysis of particle mass vs. normalized distance over all tomograms with sphere fits shows two main features: 1. There are constantly high levels of particles up to a size of ~2.5 MDa, except around the surface of the nucleoli (dashed line). 2. At this distance, a lack of smaller masses is compensated by a burst of large complexes, consistent with the detection of pre-ribosomal particles such as the SSU processome and the pre-60S. NE Nuclear envelope. Source data are provided as a Source Data file.

