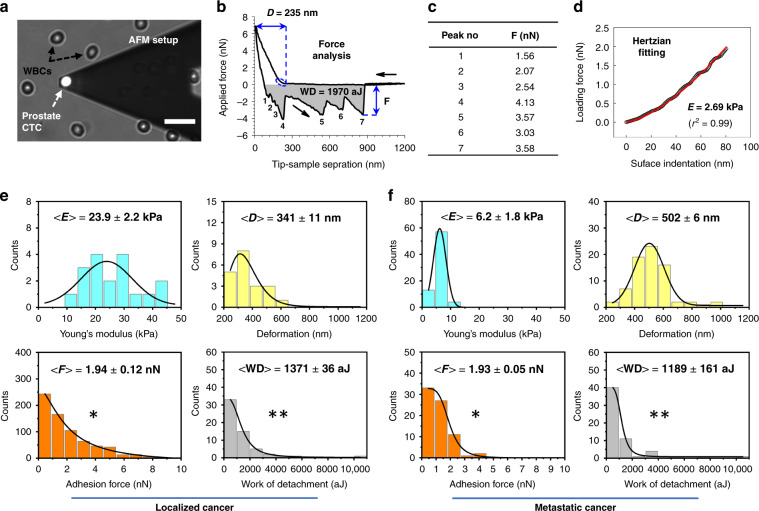
Fig. 5. AFM analysis of the microfluidic-captured intact prostate CTCs of patients with localized (Patient 4) and metastatic (Patient 6) cancer.
a A micrograph shows an AFM tip positioned above the center of EpCAM-stained CTC so that force measurements could be performed for follow-up nanomechanical characterization. The scale bar is 30 μm. b A representative force curve demonstrates the interaction between the AFM tip and the CTC, where black arrows represent the tip’s approach to and retraction from the cell surface. Following the initial tip–cell surface contact, the cell experiences an amount of surface deformation “D” due to the applied constant loading force. When the tip is retracted from the cell surface, the cell experiences a number of adhesion forces “F” (peaks 1–7 in the retraction process) due to its interactions with the AFM tip surface until the tip is completely detached from it. In the process, the work of detachment “WD” (shaded gray area below the zero-force line) indicates the amount of work needed to completely detach the tip from the cell surface. c The measured adhesion values are tabulated for all peaks in b. d After the initial tip–cell surface contact, force data (black) were fit (red) to surface indentation (~80 nm, dashed blue ellipse in b) to estimate the local Young’s modulus “E”. e, f Histograms of the distribution of all Young’s moduli E, deformation D, adhesion forces F, and work of detachment WD, as measured for CTCs of localized (n = 3) and metastatic (n = 2) cancer origins. Solid black lines are data fit to lognormal or Gauss probability density functions. Data represent the mean ± S.D. *Statistically significant and **statistically not significant at P < 0.05, as assessed by t tests

