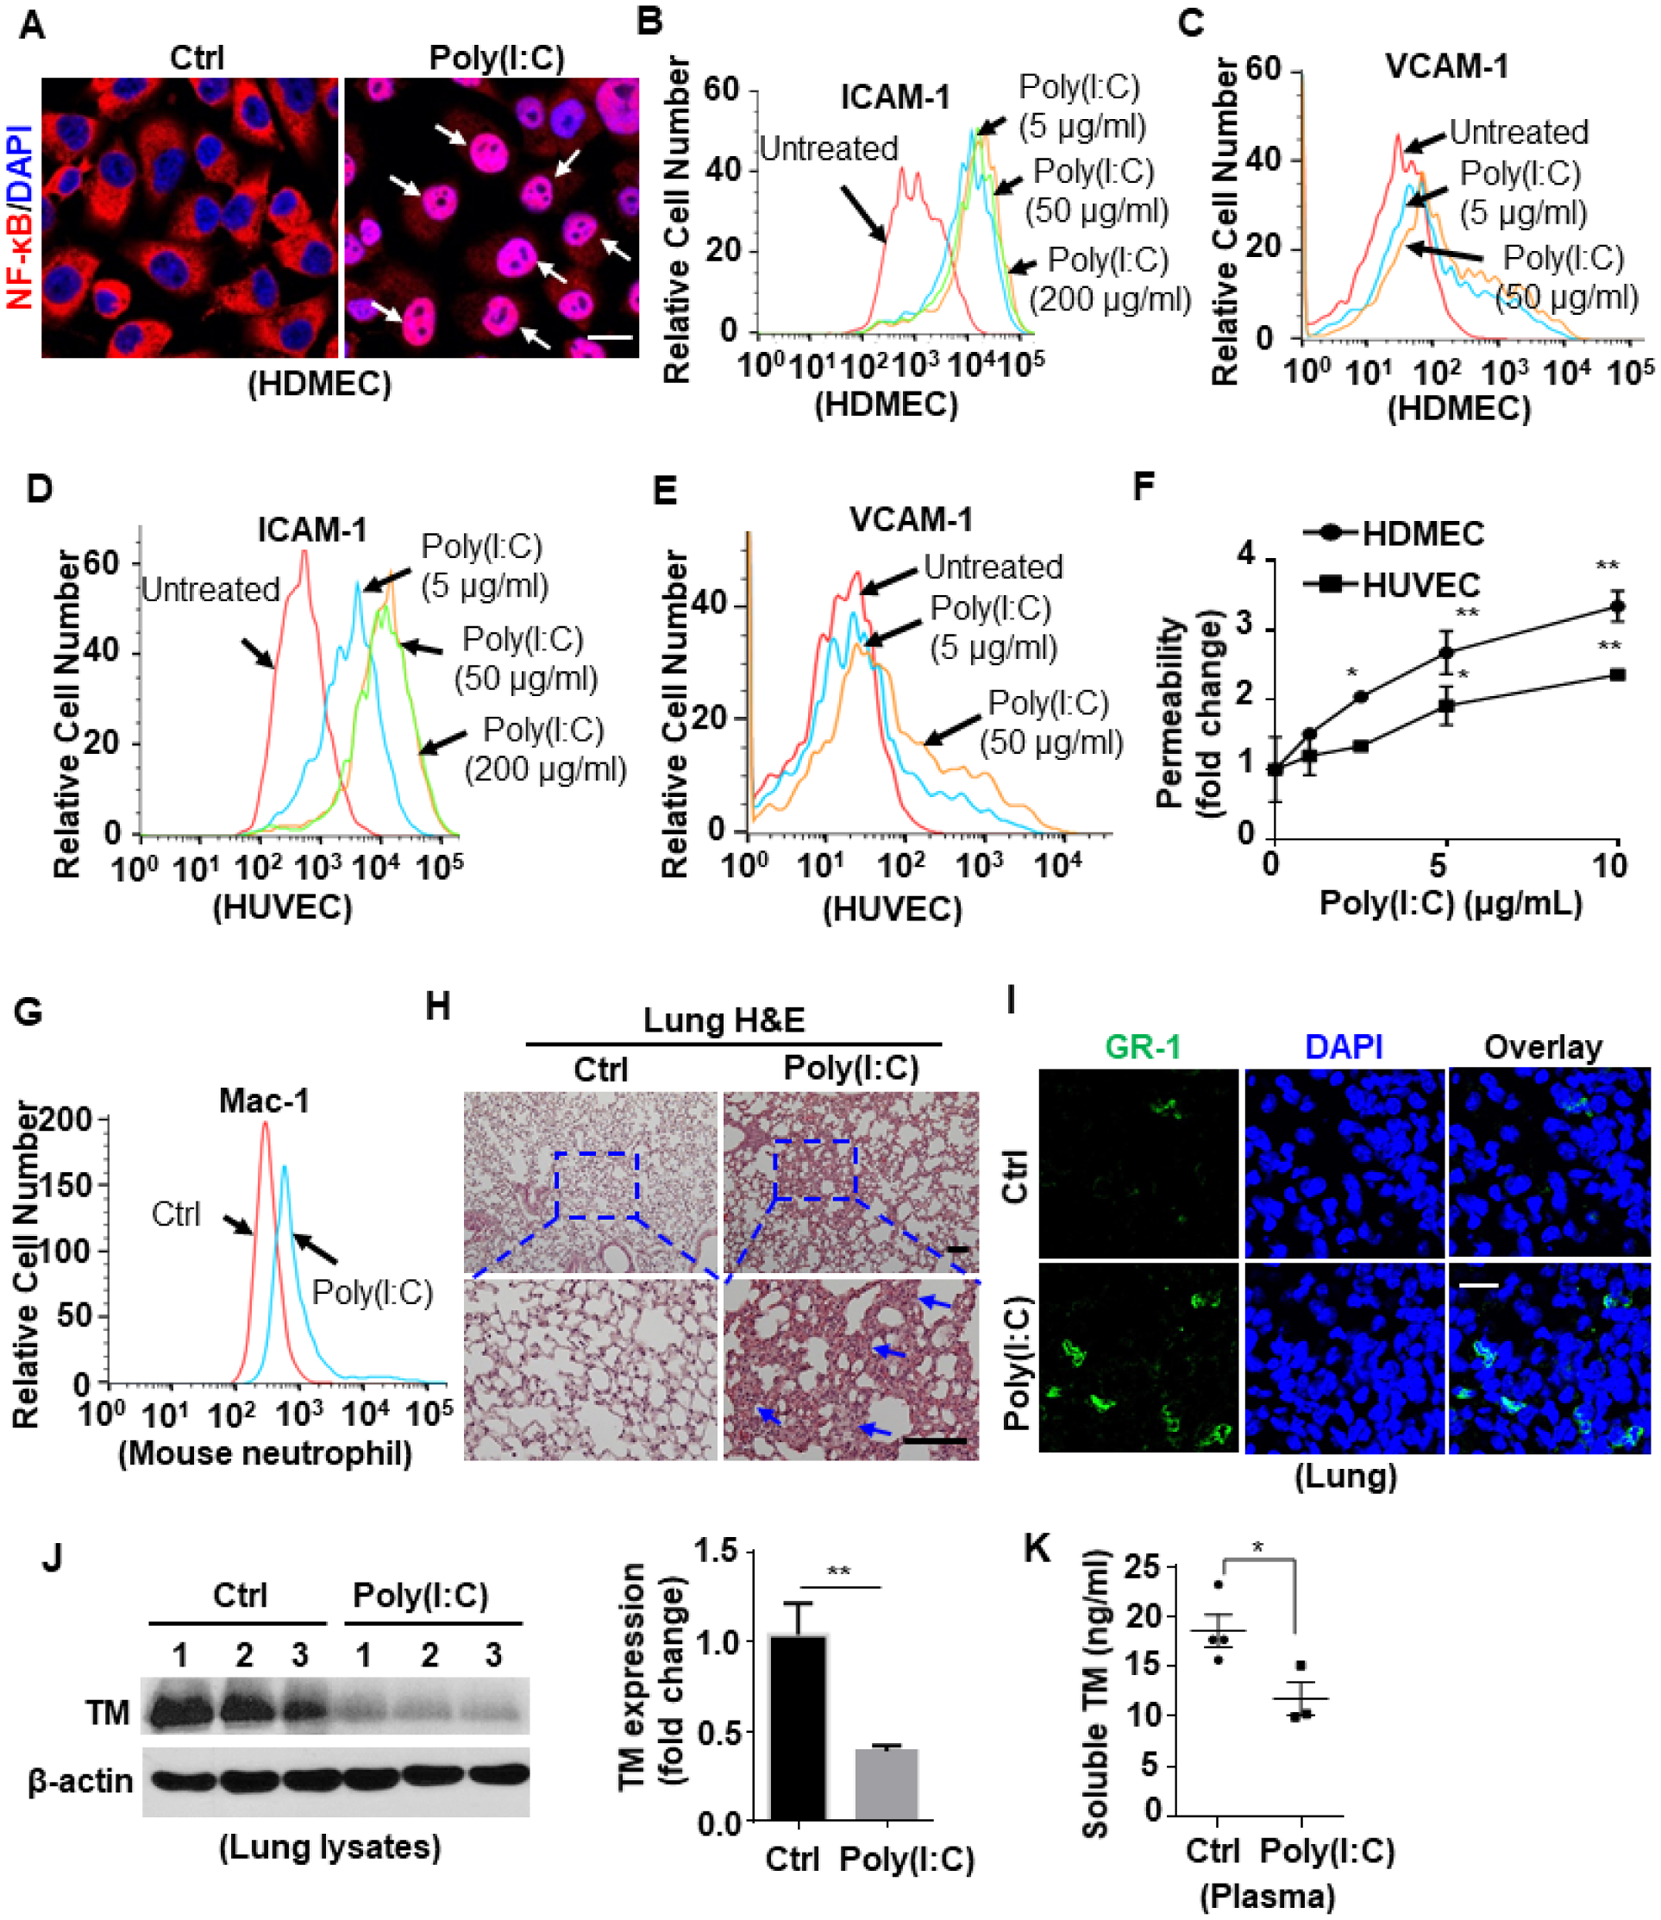
Figure 7. Poly(I:C) activates NF-κB signaling to promote inflammation.

(A) HDMECs were stimulated with poly(I:C) (10 μg/mL for 1h). Cells were then fixed, permeabilized and NF-κB p65 was stained with rabbit anti-NF-κB antibody and Alexa Fluor 555-conjugated goat anti-rabbit IgG. The nucleus was stained with DAPI. Immunofluorescence images were taken by confocal microscopy. Arrows indicate nuclear translocation of NF-κB. (B-E) Confluent HDMECs (B and C) or HUVECs (D and E) were stimulated with poly(I:C) at 5, 50 or 200 μg/mL for 6h. The cell surface levels of ICAM-1 (B and D) or VCAM-1 (C and E) were measured by flow cytometry. (F) HDMECs or HUVECs were stimulated with poly(I:C) at designated concentrations (1, 2.5, 5, 10 μg/mL) for 4h. The amount of Evans blue dye that leaked into the lower chamber in the Trans-well assay plates was measured. (G) Mice were injected i.p. with poly(I:C) for 3h and blood samples were collected and stained for Ly6G-FITC & Mac-1-PE. The cell surface expression of Mac-1 in Ly6G-FITC-positive neutrophil population was measured by flow cytometry. Representative data were obtained from 3–5 mice per group (n = 3–5). (H) Mice were injected i.p. with poly(I:C) for 3h, and lung tissue was collected and processed for histological analyses. Paraffin-embedded sections of lung tissue were stained with H&E. Representative images were obtained from 5 mice per group (n = 5). The inset boxes from each group are magnified. The arrows indicate inflammatory foci. (I) Mice were injected i.p. with poly(I:C) for 3h, and lung tissue was collected and processed. Cryosections of lung tissue were fixed and permeabilized. GR1 was stained with rat anti-GR-1 antibody and Alexa Fluor 488-conjugated goat anti-rat IgG. The nucleus was stained with DAPI. Immunofluorescence images were taken by confocal microscopy. Representative images were obtained from 3–5 mice per group (n = 3–5). (J) Mice were injected i.p. with poly(I:C) for 24h, and lung tissue was harvested for lysis. Tissue lysates were immunoblotted for thrombomodulin (TM) and β-actin. The relative expression levels of TM were quantified. (K) Soluble TM level in the plasma of saline control or poly(I:C)-injected mice was measured by ELISA according to the manufacturer’s instructions. Dot plot shows quantification of plasma TM levels from Ctrl mice (n = 4) and poly(I:C)-treated mice (n = 3). Scale bar: 10 μm (A), 200 μm (H) and 40 μm (I). All experiments were repeated at least three times. Results are shown as mean ± standard error. *p < 0.05, **p < 0.01.
