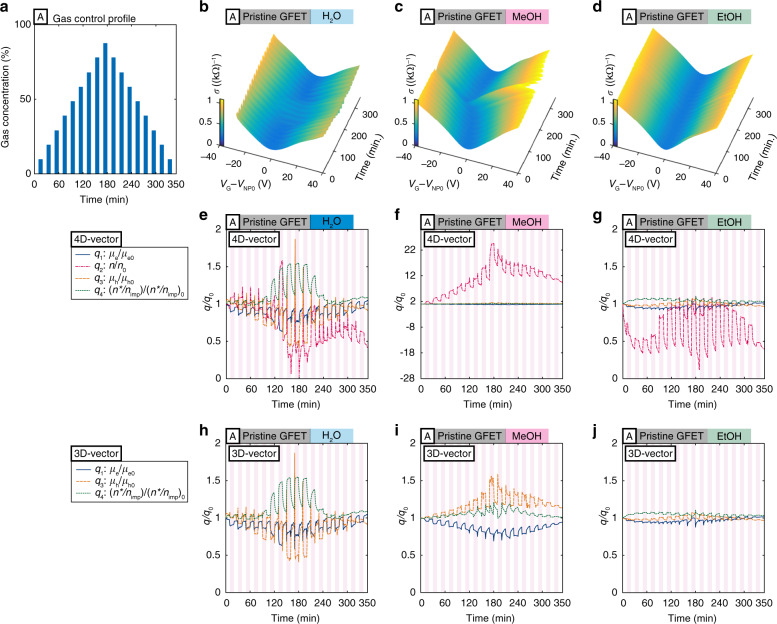
Fig. 2. Measurement results and the converted transient 4D and 3D vectors using setup A with the pristine GFET.
a Gas-concentration profile in test setup A. b–d Transient conductivity profiles versus the gate voltage with respect to time for water (H2O), methanol (MeOH), and ethanol (EtOH). e–g Relative magnitude of the converted 4D vectors versus time; h–j and relative magnitude of the 3D vectors by removing the carrier concentration vector from the 4D vectors

