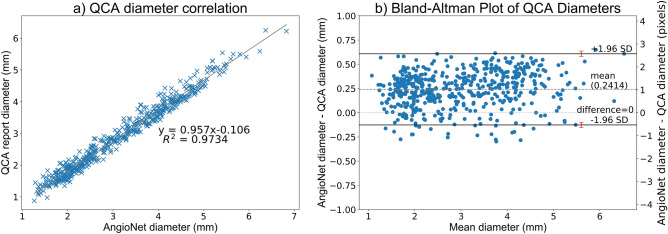
Figure 7.
(A) Correlation plot of QCA and AngioNet derived vessel diameters. (B) The Bland–Altman plot demonstrates that AngioNet’s segmentation and QCA are interchangeable methods to determine vessel diameter since more than 95% of points lie within the limits of agreement. The red error bars represent the 95% confidence interval containing the limits of agreement. The mean difference in diameter between methods is 0.24 mm or 1.1 pixels.

