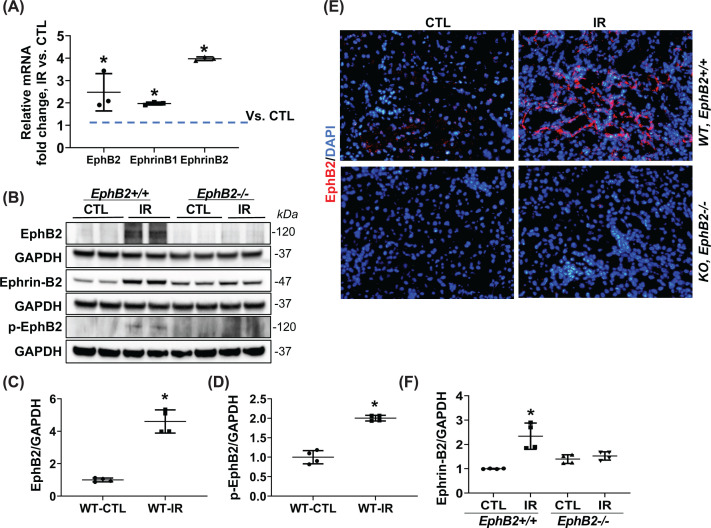
Figure 1. EphB2 expression increases in the kidney of mice following IR injury for 2 weeks.
(A) EphB2 receptor, EphrinB1, EphrinB2 mRNA levels were analyzed in kidneys of mice using real time RT-PCR. Results are shown as fold change compared with contralateral kidneys (CTL). Error bars represent mean ± SD, n=5 animals. (B) Western blots of EphB2, phosphor-EphB2 (pEphB2Y594), EphrinB2, and GAPDH from kidneys of EphB2+/+ (WT) and EphB2−/− (KO) mice. Molecular weight was labeled on the right. The graphs summarize the results of band density measurements for EphB2 (C), p-EphB2 (D), and EphrinB2 (F). *P<0.05 vs. EphB2+/+ CTL. (E) Frozen kidney sections from EphB2+/+ and EphB2−/− mice following IR injury were stained with EphB2 (red) and DAPI/DNA (blue). Magnification, ×200. There is no EphB2 detected in immunoblots or IF staining in kidneys from EphB2 KO mice.

