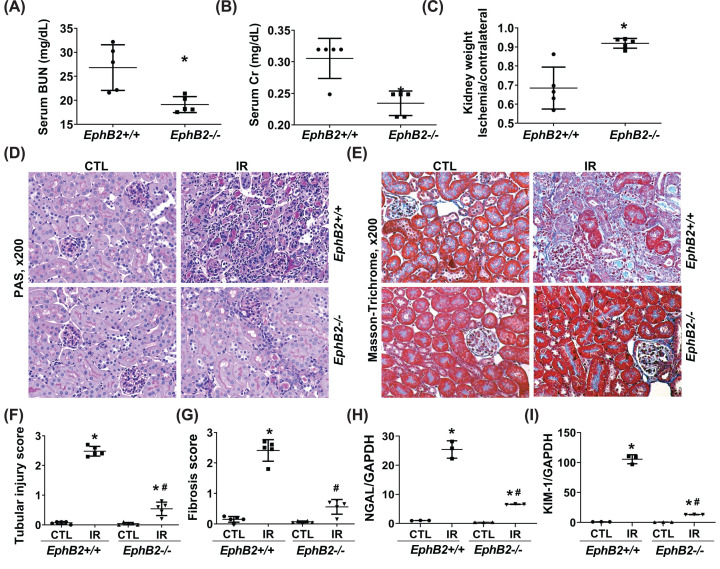
Figure 3. EphB2-KO mice exhibit ameliorated renal function and atrophy and reduced tubular injury and tubulointerstitial fibrosis following IR injury.
(A–C) Serum BUN (A), Cr levels (B), and kidney weight (C) (n=5/group). *P<0.05 vs. EphB2+/+ mice. (D,E) Representative microscopic images showing PAS staining (D) and Masson’s Trichrome staining (E) of the kidney sections used to detect tubular injury, inflammation, and collagen deposition (stained blue). Magnification, ×200. (F,G). The graphs summarized the results of tubular injury (F) and collagen deposition (G) quantified by ImageJ. (H,I) mRNA expression of tubular injury markers, NGAL (H) and KIM-1 (I) in the kidney following IR injury. *P<0.05 vs. EphB2+/+ contralateral kidney (CTL). #P<0.05 vs. EphB2+/+ IR-injured kidney.

