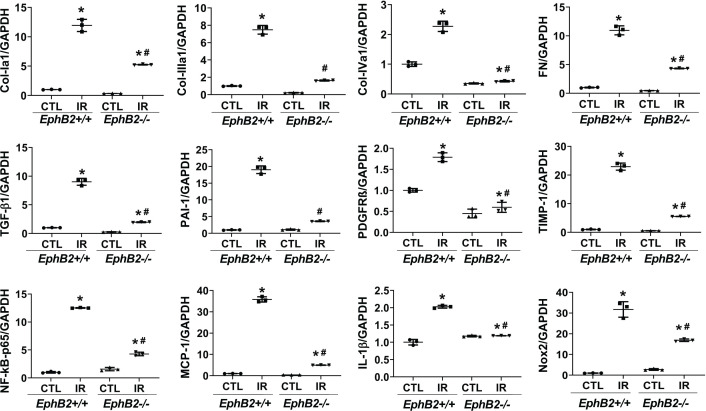
Figure 5. Quantitative RT-PCR for gene expression analysis of the profibrotic and inflammatory markers.
Total RNA was prepared from contralateral (CTL) or IR-injured kidneys of EphB2+/+ and EphB2−/− mice. Data are mean ± SD, n=5 animals per group. *P<0.05 vs. EphB2+/+ CTL, #P<0.05 vs. EphB2+/+ IR-injured kidney.

