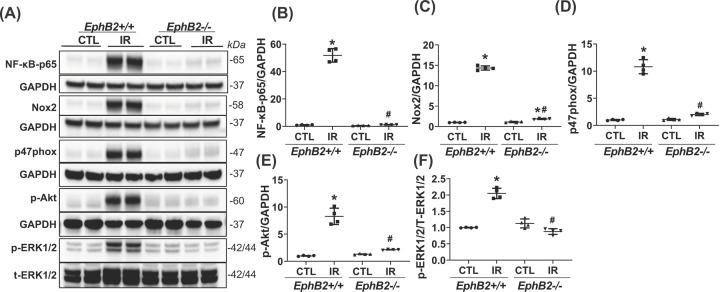
Figure 6. Renal protein levels of inflammatory, oxidative stress, and proliferative markers.
(A) Western blots of NF-κBp65, Nox2, p47phox, p-Akt, pERK1/2, t-ERK1/2, and GAPDH from contralateral (CTL) and IR-injured kidneys of EphB2+/+ and EphB2−/− mice. Molecular weight was labeled on the right. n=5 animals/group. (B–F) The graphs summarized the results of band density measurements for NF-κB-p65 (B), Nox2 (C), p47phox (D), p-Akt (E), pERK1/2/t-ERK1/2 (F), respectively. *P<0.05 vs. EphB2+/+ CTL. #P<0.05 vs. EphB2+/+ IR-injured kidney.

