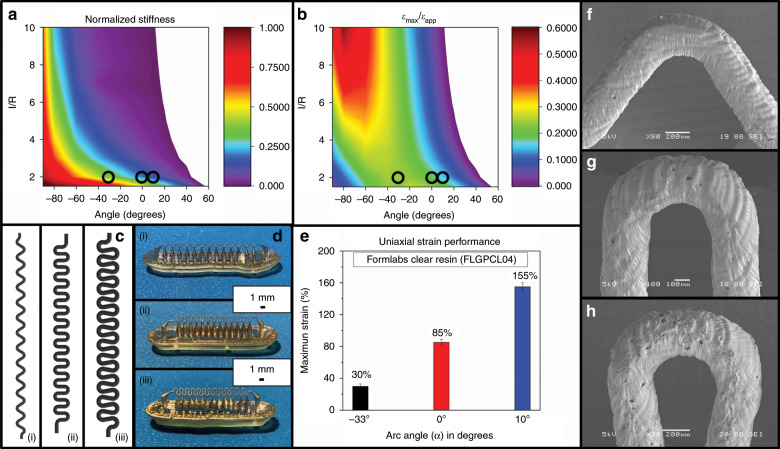
Fig. 2. Graphical representations of the µserpentine modeling equations and simple strain data, with images of the printed µserpentines.
a Contour plot of the normalized stiffness for a µserpentine (with Formlabs Clear resin) calculated from the analytical model developed using Eq. 1. The hotter colors denote conformation closer to the stiffness of a flat ribbon (where α = −90°). Circles indicate the design choices for this work. b Contour plot of the maximum effective strain on the inner U-bend of a µserpentine, calculated from the analytical model developed using Eq. 2. The lower values in this contour plot indicate a higher maximum effective strain that can be applied before failure. Circles indicate design choices for this work. c (i–iii) Schematic representations of the three chosen µserpentine designs, from α = −33° (i), to α = 0° (ii), and α = 10° (iii). d Optical micrographs of the µSLA 3D printed µserpentines after metallization corresponding to their schematics in c. e Experimentally measured maximum uniaxial strain of the three µserpentine designs, leading to the down selection of the α = 10° design. f–h SEM images of the three µserpentine designs corresponding to (i–iii) in c. The minor print defects seen from the µSLA printing process do not impact the design’s performance and are consistent across all prints.

