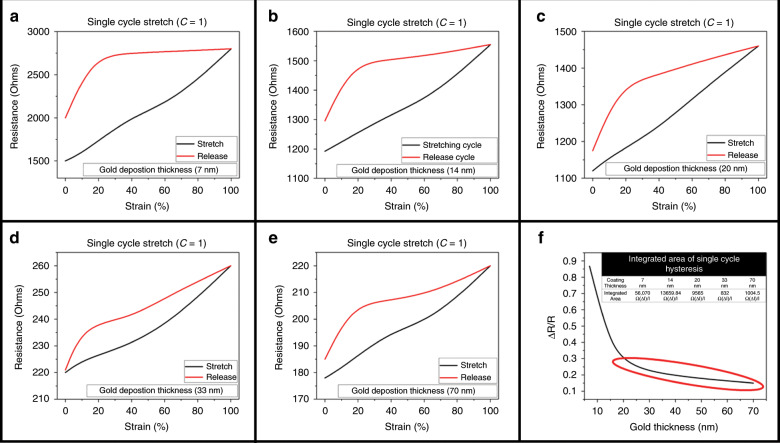
Fig. 3. Single cycle hysteresis (strain and release) graphs for each of the Au coating thicknesses.
a 7 nm coating hysteresis cycle. b 14 nm coating hysteresis cycle. c 20 nm coating hysteresis cycle. d 33 nm coating hysteresis cycle. e 70 nm coating hysteresis cycle. f ΔR/R for each of the coating thicknesses. The red highlighted area indicated coatings that are more suitable for consistent conduction performance over strain, including the 20, 33, and 70 nm coatings. The inset table lists the tabulated hysteresis integration areas, indicating the most (33 nm) and least (7 nm) consistent conduction performance over the single cycle.

